TRADE RESULT - AUD USD
Trade Type
|
Breakout, Medium Consolidation
|
Signal Needed
|
Daily Chart
|
Target
|
Breakout Equivalent
|
Result
|
-100 Pips
|
________________________________________________________________________
The intention here was to continue to go long in favour of the Aussie in response to the breakout signal provided above the Daily Chart's Pennant. The pair had actually formed a smaller Pennant above a larger Pennant before providing the Bull Candle Signal for entry. Instead of breaking higher, however, the currency pair reversed unexpectedly despite having a strong setup and signal. So what could have been the reason for this loss?
Let's first take a look at what the overall picture was on the Daily Chart. As we see in the chart below, the smaller Pennant was essentially testing the broken Resistance before giving the breakout signal.
DAILY CHART
 |
| Source: FXCM Marketscope |
This was also taking place in an uptrend that added support for the currency pair to continue moving higher. Following the close of this candle, entry took place immediately with the Stop Loss set at the appropriate point on the 4 Hour Chart and the target of the Breakout Equivalent put in place. Within a few days, the market reversed sharply to take out the trade, resulting in the loss of 100 Pips.
DAILY CHART
 |
| Source: FXCM Marketscope |
The issue at hand now following this loss and trading losses in general, is to ascertain the possible cause especially given the apparent clarity and strength of this setup. Two separate, but related reasons could provide the answer.
SCENARIO 1
It is quite possible that these two Pennants are actually about to give way to the formation of a larger Range Setup. This is something that happens from time to time in the currency market. If this is the case, then we could see a pattern that looks like this.
DAILY CHART
If this is what will be formed, then we could either see another bullish signal to continue the uptrend or a bearish breakout that starts a downtrend.
SCENARIO 2
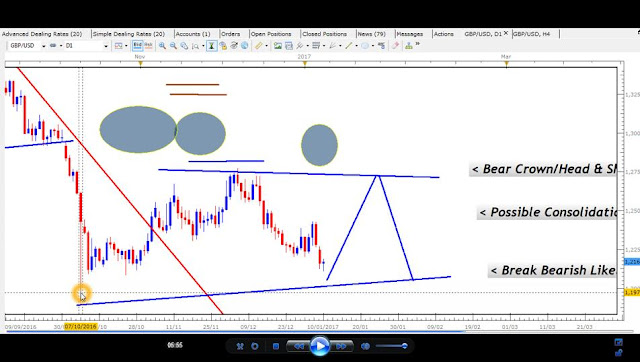
The alternate scenario involves taking a wider view of this currency pair's previous patterns. The unexpected reversal that took place could actually be the start of a bearish wave within a much larger Consolidation setup that is being formed.
DAILY CHART
 |
| Source: FXCM Marketscope |
Confirmation of this will come in the upcoming days or weeks in the form any of these Candlestick Formations below the Uptrend Line;
- ABC Reversal Signal;
- Formation & Break of Small Consolidation;
- Counter Trend Line Setup & Break;
Provided they are strong, any of these signals could lead to a steady downtrend over the next few months until Support is hit, over 500 Pips away.
With any successful Methodology that is applied to the currency market, losses are always expected along the way in between profitable trades. One of the distinguishing advantages of trading with the higher time frames, however, is that it allows the trader a lot more time to calmly analyze the reasons for these losses and make adjustments where necessary. This helps to take the emotions out of trading and avoid the common habit of trying to exact immediate revenge on the market - a habit that inhibits long-run profitability in Day Trading.
Let's patiently waiting on the next opportunity that this market will provide on this or any other currency pair as we start a new month.
RECENT EMAIL FROM CLIENT
____________________________________________________
SUBSCRIBE TODAY


Hello Ya'll,
ReplyDeleteI've attached a list of the most recommended FOREX brokers:
1. Most Recommended Forex Broker
2. eToro - $50 min. deposit.
Here is a list of the best forex tools:
1. ForexTrendy - Recommended Odds Software.
2. EA Builder - Custom Indicators Autotrading.
3. Fast FX Profit - Secret Forex Strategy.
Hopefully these lists are benificial to you.