Posts

Showing posts from December, 2015

GBP CAD PROVIDES A 140-PIP TRADING GAIN FROM FALSE CONSOLIDATION BREAKOUT REVERSAL

Image
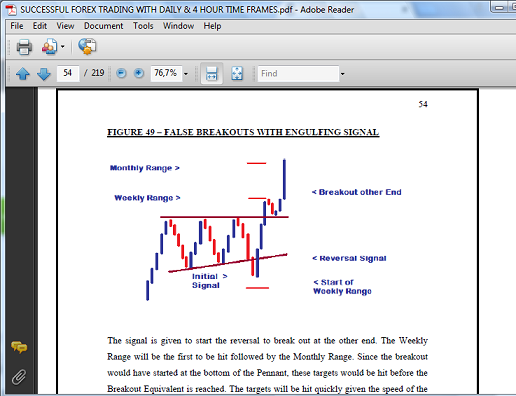
This successful trade took advantage of the sharp False Breakout Reversal from the Pennant Consolidation on the Daily Chart that started on December 3, 2015. As with all of these types of setups, the initial breakout attempt was quickly taken out by a strong, opposing signal that led to a breakout at the other end of the Consolidation. Given that this setup was in sync with the theory of False Breakouts that is outlined on Page 54 of the Trading Manual, the trade provided a strong gain of 140 Pips. The graph below shows one of the examples of False Breakouts that are explained in detail in the Manual. FALSE BREAKOUT SETUPS As you can see from the Daily Chart of the GBP CAD below, the setup was almost exactly the same as the one above.  DAILY CHART FALSE BREAKOUT PENNANT SETUP (FXCM Charts used to provide Entry Signals based on the New York Candle Close of the Daily Chart) Following the Bear Candle that attempted a breakout at Support, the bulls

FORECASTING TOOLS THAT ALL FOREX TRADERS NEED

Image
The Candlestick Signal and Patterns in the Trading Manual are extremely powerful in forecasting and taking advantage of the Currency Market each week. However, even if you are a Swing Trader or Day Trader with your own trading strategy, the power of these tools to accurately predict major market movements will definitely enhance your trading success. The Daily and the 4 Hour Charts are undoubtedly two of the most significant time frames in the Forex Market. This therefore means that breakouts and reversals that take place on these charts have a major impact on the other time frames you trade on and your profitability in general. By ignoring them as Day Traders, you could be caught by surprise with reversals that appear out of nowhere while as Swing Traders, you could miss additional signals that provide even more trading opportunities. There are various patterns of Candlesticks that have been identified to predict the formation of Consolidations as well as when reversals

ACCURATE EXIT STRATEGIES PROVIDE GAINS AHEAD OF SHARP REVERSALS

Image
Last month, the EURO JPY and CHF JPY pairs broke their respective Consolidation Setups on their Daily Charts to start downtrends in favour of the Japanese Yen. This was expected to provide several hundreds of Pips in gains for traders over several weeks given the size of the Consolidations that were broken. However, although the CHF JPY did move by over 200 Pips (providing us with a 101-Pip gain), the EURO JPY only provided us with just under 50 Pips in profits before pulling back.  Nevertheless, despite the combined profitability of these trades being lower than expected, the sharp 400-Pip reversals that took place highlighted the accuracy of the Holding Periods used for these Swing Trading Strategies. EURO JPY TRADE A target of 172 Pips was initially set to be captured from the Pennant breakout below its Support boundary. However, due partly to the lack of market activity during the Thanksgiving holiday period, the trade was only up by 47 Pips at the end of the H