Posts

Showing posts from June, 2014

THOSE PESKY FALSE BREAKOUTS- WHAT DO WE DO?

Image
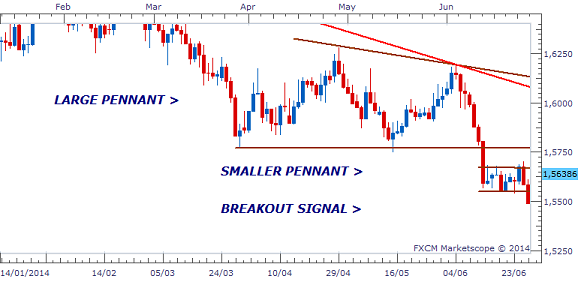
False breakouts are one of the necessary evils of the Forex market. Signals that appear to indicate the start of large gains for the trader often turn out to be broken promises that lead to unexpected losses. Spotting the signs that actually give a heads-up as to the potential for these reversals helps to avoid these scenarios that arise during long periods of market indecision and low liquidity. Take the recent movements of the EURO NZD and the GBP AUD as examples. These both gave bearish signals that broke the Support of their respective Consolidations that had formed below larger Pennants setups. Given that these smaller Consolidations represented a test of the Support of these broken Pennants, gains of several hundred pips would have been expected. EURO NZD - DAILY CHART Source: FXCM Marketscope DAILY CHART- GBP CAD Source: FXCM Marketscope Nevertheless, the candles that broke these setups were not strong enough to justify ent

EURO USD BIASED TO THE DOWNSIDE

Image
EURO USD CONSOLIDATION BREAKOUT- USD GAINS AHEAD The current indecision of this pair can be partly explained by the limited activity in the market in general, low liquidity and investigations into illicit trading practices. However, there is also an explanation based on the natural Price Action movements that can be seen throughout the currency market. The chart below shows that the currency is actually above the Resistance of a large Pennant setup on the Weekly Chart that was formed after sharp gains for the USD during the Financial Crisis of 2008. The current position, seen on the right-hand side of the chart, shows that a smaller Pennant has also been formed after a rally to this area ended in October of 2013. WEEKLY CHART Source: FXCM Marketscope Consolidations such as these tend to be formed after sharp, fast movements that end trends or when a currency pair has reached its Weekly or Monthly Range. As the market moves

GBP USD Rally or More Sideways Dancing?

Image
In line with growing expectations of an increase in interest rates, the British Pound has been in an uptrend against the US Dollar since August of 2013. During this time, the currency has rallied by approximately 2000 Pips, breaking the Resistance of the large Pennant Consolidation on the Weekly Chart along the way. With the pair now above this boundary, we could either see further gains for Sterling for the rest  of the year or a continuation of the patterns of sideways movement on the Daily Chart . PENNANT BREAKOUT The Chart below shows the breakout that has taken place from the Pennant setup on the Weekly time frame. This formation followed the sharp gains for the USD during the period of risk aversion in 2008.  Under normal circumstances, breakouts from consolidations such as these are normally fast and sharp. However, in this case the breakout has been somewhat laboured, reflecting the current period of indecision and low market liquidity affecting the market.  WEEKLY

RBNZ Cuts, EURO NZD Drops, PIPS Lie Ahead

Image
After moving within a 400-Pip Range since the end of March this year, the EURO NZD has finally broken this boundary with a break of Support following the increase in interest rates by the Reserve Bank of New Zealand (RBNZ). The pair fell by more than 200 Pips within 24 hours of the decision to form a strong bearish candle below the Range, indicating the start of even stronger gains for the Kiwi in weeks to come. THE RATE CUT The RBNZ took the decision to raise the official cash rate to 3.25% from 3.00% as it seeks to stave off inflationary pressures that have begun to threaten the economy. In justifying the move, RBNZ Governor Graeme Wheeler stated that it was important that inflation expectations remain contained and that interest rates return to a more neutral level. Naturally, in an environment of homogeneous interest rate policy among the major central banks, the increase led to strong demand for the Kiwi against several of its counterparts including the US Dollar, the A

Solution to Low Currency Volatility? Multiple Lot Trading

Image
The low volatility environment in the Currency Market has made it very difficult for traders to earn at the same rate as under normal conditions. Low interest rate policies by the major central banks and investigations into market rigging have contributed significantly to the downturn in market activity.   As a result, trends have been short-lived, forcing traders to either be extremely patient or find new strategies to adjust to the market.  With this in mind, there is an aggressive trading option available for the traders whose main strategy is Swing Trading. This option is popularly known as Multi-Lot Trading and involves adding positions to an existing trade to maximize on the trend on its way to the final target.  SINGLE & MULTIPLE LOT TRADING The more conservative way to trade the larger trends is to open a single position on a currency pair and hold it until the target is hit a few days later. However, with the limited number of trends being provided by the market,