THOSE PESKY FALSE BREAKOUTS- WHAT DO WE DO?
False breakouts are one of the necessary evils of the Forex market. Signals that appear to indicate the start of large gains for the trader often turn out to be broken promises that lead to unexpected losses. Spotting the signs that actually give a heads-up as to the potential for these reversals helps to avoid these scenarios that arise during long periods of market indecision and low liquidity.
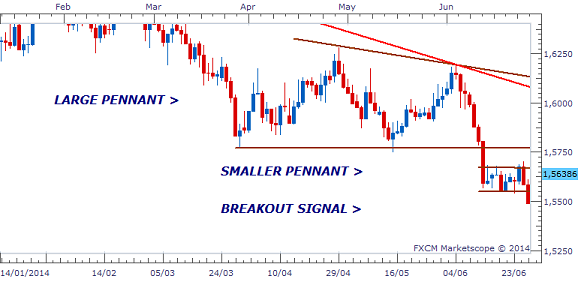
Take the recent movements of the EURO NZD and the GBP AUD as examples. These both gave bearish signals that broke the Support of their respective Consolidations that had formed below larger Pennants setups. Given that these smaller Consolidations represented a test of the Support of these broken Pennants, gains of several hundred pips would have been expected.
EURO NZD - DAILY CHART
 |
| Source: FXCM Marketscope |
DAILY CHART- GBP CAD
 |
| Source: FXCM Marketscope |
Nevertheless, the candles that broke these setups were not strong enough to justify entry. Whenever this happens, you will either have a stronger candle that appears a few days later to continue the breakout, or an opposing candle that starts a False Breakout reversal. In this case, the latter was the result for both pairs.
 |
| Source: FXCM Marketscope |
From this point, we could have one of two scenarios unfolding in the next few days. We could see the market move sideways for awhile before providing another set of bearish signals that start their respective downtrends. On the other hand, the reversals could indicate that start of uptrends that take them back inside of their Pennants, possibly breaking out above the Resistance. But how can we know in advance that what seems like perfectly normal signals will actually lead to these types of reversals?
Practice, practice, practice. With Candlestick Patterns, one has to review several examples of breakouts to be able to quickly distinguish between the ones that lead to breakouts and those that will only cause unnecessary headaches for traders. This will allow you to confidently enter and trade those that will actually break and provide strong gains over a very short period.
DAILY CHART- CHF JPY
 |
| Source: FXCM Marketscope |
DAILY CHART- USD CAD
 |
| Source: FXCM Marketscope |
The concept of the average Daily Range of a currency pair is also important. Most breakout candles that lead to trends are usually the same size of the Daily Range of that pair. This range also varies among currencies such that a normal candle that is acceptable to be traded for one currency pair may not be strong enough for another. One must also be able to determine if the candle and the start of a potential breakout would also coincide with the Weekly Range of that pair. This would significantly increase the possibility of a reversal such as that which is now taking place on the EURO USD.
DAILY CHART - EURO USD
 |
| Source: FXCM Marketscope |
_RECENT EMAIL FROM CLIENT
____________________________________________________
SUBSCRIBE TODAY


Hello Everybody,
ReplyDeleteBelow is a list of the highest ranking FOREX brokers:
1. Best Forex Broker
2. eToro - $50 minimum deposit.
Here is a list of the best forex instruments:
1. ForexTrendy - Recommended Odds Software.
2. EA Builder - Custom Strategies Autotrading.
3. Fast FX Profit - Secret Forex Strategy.
Hopefully these lists are benificial to you.