GBP USD Rally or More Sideways Dancing?
In line with growing expectations of an increase in interest rates, the British Pound has been in an uptrend against the US Dollar since August of 2013. During this time, the currency has rallied by approximately 2000 Pips, breaking the Resistance of the large Pennant Consolidation on the Weekly Chart along the way. With the pair now above this boundary, we could either see further gains for Sterling for the rest of the year or a continuation of the patterns of sideways movement on the Daily Chart.
PENNANT BREAKOUT
The Chart below shows the breakout that has taken place from the Pennant setup on the Weekly time frame. This formation followed the sharp gains for the USD during the period of risk aversion in 2008. Under normal circumstances, breakouts from consolidations such as these are normally fast and sharp. However, in this case the breakout has been somewhat laboured, reflecting the current period of indecision and low market liquidity affecting the market.
WEEKLY CHART
 |
| Source: FXCM, All Rights Reserved |
This slow movement of the currency can also be seen on the Daily Chart in the form of small periods of consolidation and pullbacks above the Pennant.
DAILY CHART
 |
| Source: FXCM, All Rights Reserved |
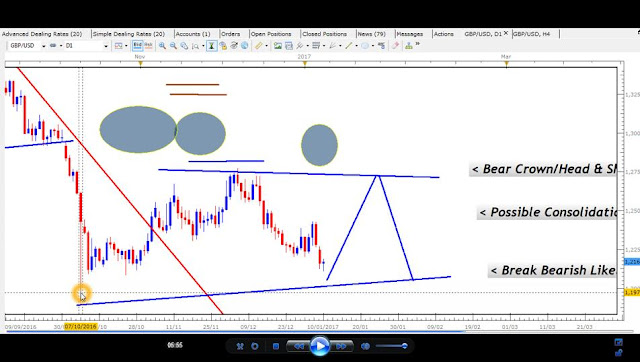
From this point, the trend could either could continue with a U-turn in the next few days, or a sharp move down to form a Range for another period of market indecision.
UPTREND SCENARIO
If the break of the Counter Trend Line takes place within the next few days, we would see an uptrend that takes us up towards the 1,7350 area. This target would be in line with the Weekly Range of the GBP USD pair that is 400 Pips on average.
DAILY CHART
 |
| Source: FXCM, All Rights Reserved |
This uptrend would form an Inner Uptrend Line that would support the new breakout that could last over the subsequent 7 to 10 days.
CONSOLIDATION SCENARIO
If, however, this U-turn does not take place and the USD continues to gain strength, it could lead to the formation of a Range that takes the pair down to Support at 1,6991. This would see the start of downtrend and uptrend waves that lead to the formation of this consolidation.
DAILY CHART
 |
| Source: FXCM, All Rights Reserved |
Taking advantage of this scenario would involve buying at Support and selling at Resistance within this large 300-Pip-Wide Range. Strong Candlestick Formations that start the movements between these boundaries will be needed to pocket these gains over the next few weeks. The stronger and clearer these entry signals, the faster the movements to the other end of the boundary with very little volatility and reversals taking place to take out our Stop Losses.
The best ones to trade within these types of Setups are;
- ABC Reversal Signals;
- Double Bottoms/Tops;
- Breaks of Trend Lines within the Range;
- Breaks of Small Consolidations;
RECENT EMAIL FROM CLIENT
____________________________________________________
SUBSCRIBE TODAY


Hello Everyone,
ReplyDeleteBelow is a list of the highest ranking FOREX brokers:
1. Most Recommended Forex Broker
2. eToro - $50 minimum deposit.
Here is a list of top forex instruments:
1. ForexTrendy - Recommended Probability Software.
2. EA Builder - Custom Strategies Autotrading.
3. Fast FX Profit - Secret Forex Strategy.
Hopefully these lists are helpful to you...