Methodology Turns Currency Fund Managers into Amateurs
Within the context of extremely low currency volatility in 2014, negative and flat rates of returns have been the norm for Currency Traders around the world. The Barclays BTOP FX index is down by 4,36% year-to-date as at July 31, 2014 and with the challenging environment expected to continue, the outlook appears to be bleak for traders. Yet, how is it that despite this challenging environment, a simple Methodology continued to generate large rates of returns with signals that have identified high paying trades over the last 5 years of Financial turmoil?
The table below shows the results of trades and setups that have been identified by this Methodology so far this year. The returns assume a very conservative Risk per Trade of 2% on a trading account of US$100,000.
TABLE 1- YEAR-TO-DATE JULY 1, 2014

Although these setups appeared an average of just twice a month, the size of their targets and the accuracy of the signals were more than able to compensate. Below are a few examples of these setups.
NZD CAD - DAILY CHART

CAD CHF - DAILY CHART

GBP USD - DAILY CHART

EURO NZD - DAILY & 4H CHARTS


USD CAD - DAILY CHART

Similar opportunities were also provided over the last few years in which the market was affected by the aftermath of the 2008 Financial Crisis. Heightened uncertainty, budget crises, debt crises and extraordinary policy measures still gave the fortunate users of this Methodology strong gains on several occasions.
EURO USD- DAILY CHART

USD CAD - DAILY CHART

EURO JPY - DAILY CHART

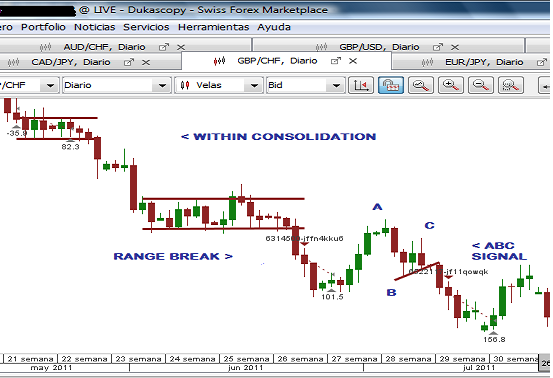
GBP CHF - DAILY CHART

METHODOLOGY
The Methodology is based on identifying High Probability setups across the Currency Market, using only the Daily and 4 Hour Charts. Specific combinations of Japanese Candlestick Formations and Signals were found to provide a consistently high rate of accuracy when used within certain parameters established on these time frames. These charts offer a greater degree of stability relative to the smaller charts, while offering practical Risk-Reward ratios for the average Retail Trading account.
The main aspects of the strategy involve;
- Identifying Market Direction using Candlestick Patterns;
- Waiting on the Daily & 4 Hour Charts for Entry Signals;
- Aiming for 100-200 Pips per trade;
- Holding Trades for a Pre-determined Holding Period;
Trading is focused on the larger trends of the most liquid currency pairs away from the noise and chaos of the lower time frames. It is a type of Swing Trading system in which trades are held for a few days at a time in contrast to the quick turnover approach of Day Trading. The Methodology also makes use of the Weekly and Monthly Ranges hardly seen in other Swing Trading systems, but which are crucial to entry and exit decisions.
ECONOMIC DATA & STATISTICAL INDICATORS
The use of short-term economic data has been found to be unnecessary for successful trading. In most cases, the net reaction of the market to any major news item will be reflected in the Candlesticks of the larger charts. It is therefore more prudent to simply wait on these signals to provide market direction for the larger and more profitable currency movements. Statistical Indicators are mathematically-based and can be lagging in nature. Experimenting with several of these to find the perfect signal or combination of signals can be a tedious and unrewarding task especially if done on the lower time frames.
TRADE MANUAL
The Methodology has been put together in an extensive 166-Page e-Book that can be used by individuals and professionals seeking to complement or replace their existing trading systems. This manual and the strategy explained will provide;
- New insights that surpass the recycled trading information in free & low-cost books/manuals;
- Predictable times for entry using the Daily and 4 Hour Charts;
- Actual step-by-step Trade Sheet instructions;
- Practical ways to avoid checking trades before targets are hit;
- Pre-determined exit rules based on each trade setup;
- Weekly & Monthly Ranges not seen in any other strategy;
- The 4H Chart candles to avoid depending on the time of day;
- Spotting the start of Consolidation and False Breakouts;
- Clear Candlestick Patterns that start and end Trends;
- Real examples of each Technical Factor explained;
- A Proven set of parameters built on 10 years of trading and analysis of market patterns;
In addition to this, Subscribers who email the Code at the end of the Trading Manual will receive;
- Trade Setups sent 30 Minutes before Entry;
- Personalized Analysis of Preferred Currency Pairs;
- Excel Sheet Setup for Trade Decisions & Leverage Calculations;
When this Trade Manual is combined with detailed Chart Analysis and interaction provided daily on this site, a real source of Long-Term Income & Wealth awaits.
RECENT EMAIL FROM CLIENT

____________________________________________________
SUBSCRIBE TODAY
____________________________________________________


 |
| US$120.00 |
 |
___________________________________________
Duane Shepherd
(M.Sc. Economics, B.Sc. Management and Economics)
Currency Analyst/Trader
Contact: shepherdduane@gmail.com
Twitter: @WorldWide876
Facebook: DRFXTRADING


Comments
Post a Comment