HIGHER & LOWER TIME FRAMES - THE DYNAMIC YOU WONT SEE ANYWHERE ELSE

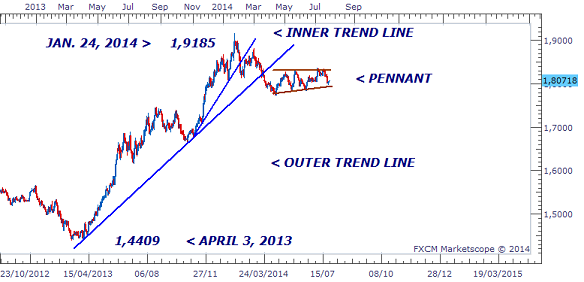
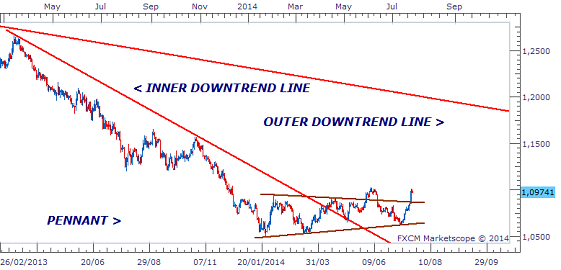
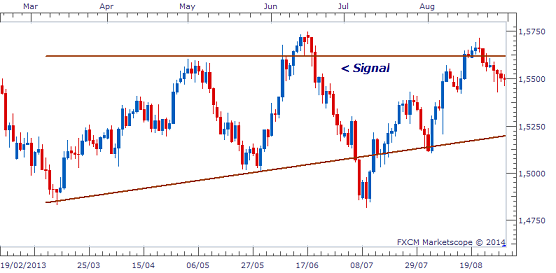
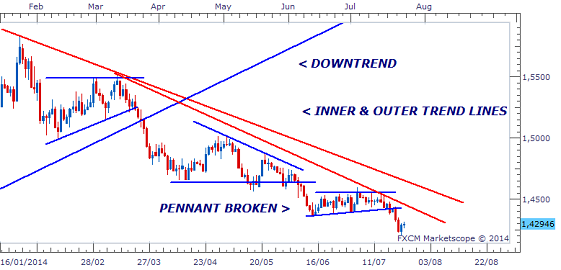
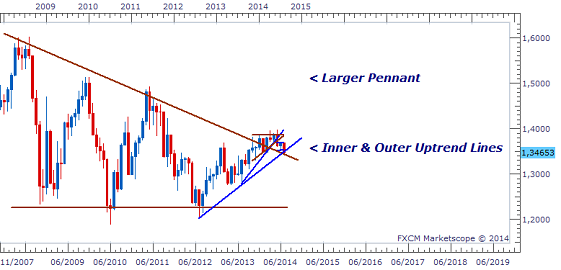
THE DYNAMIC RELATIONSHIP At the start of a trend on the Daily and 4 Hour Charts, one will notice a unique relationship between these charts that is also replicated on other time frames. For every candle seen on a Larger Time Frame, there is a setup and signal on a corresponding Lower Time Frame that led to that candle. Then, in a recursive manner, every candle on the Larger Time Frame that is going to lead to a trend, produces another setup and signal on the Lower Time Frame in response to that candle. To make this even more complicated, the time it takes for the Lower Time Frame to respond to that signal is approximately the same as the Larger Time Frame. This relationship takes place between all Higher Time Frames and Lower Time Frames that are directly linked to each other, from the Monthly Chart down to the 1 Minute Chart. Here are the pairs of time frames that are directly linked to each other that follow this pattern of setups and signals. LARGER & LOWE...
