DAILY MARKET UPDATE 1 - TUESDAY JANUARY 23- CHF JPY REVERSAL AHEAD?
As was expected yesterday, the CHF JPY has become somewhat unstable now, with the pair showing Bullish intentions and threatening to either rally or move sideways in Consolidation, following a weak and unconvincing Bearish Signal given a few hours ago.
The Chart below shows the Bearish Break of the Counter Trend Line that has now been taken out by a Bullish movement.
4 HOUR CHART BEARISH BREAK & RALLY

This is now pointing to the possibility of either a Strong Reversal started by the formation of a Double Bottom Signal...


..or the formation of a Consolidation Setup that either leads to the resumption of the Bearish Trend or starts a Bullish Reversal...

As always, whenever the market is giving mixed signals, stay away from the pair and trade another one until this pair provides greater clarity with stronger signals.
MAIN TECHNICAL FACTORS DISCUSSED
1. Weak vs Strong Counter Trend Line Setups
2. Weak vs Strong Candlestick Formations
3. The Formation of Double Tops and Bottoms and Consolidations after weak Counter Trend Line Breaks
4. The Number of 4 Hour Candles that make Counter Trend Lines Stable vs Volatile and Risky to Trade
________________________________
Forecasting Accuracy you can enjoy Every Week by Subscribing to my World Class Mentoring Service.
________________________________

________________________________

________________________________
THE TRADING STRATEGY & MENTORING SERVICE
The Graph below illustrates the Aggressive 24 Hour Strategy that I use on my Live Account which takes advantage of the ability to accurately forecast the Weekly Range of Exchange Rate Movements of Currency Pairs using the Larger Time Frames.

There are times when trades that offer less than 50 Pips or more than 70 Pips are also targeted, so long as the setup is strong enough to justify taking the risk. All trades are held for a maximum of 24 Hours since this was discovered to be the time needed for the High Probability Trades to hit their Pip Targets. It also imposes a level of discipline that prevents us from being greedy.
Rate of Return Targets
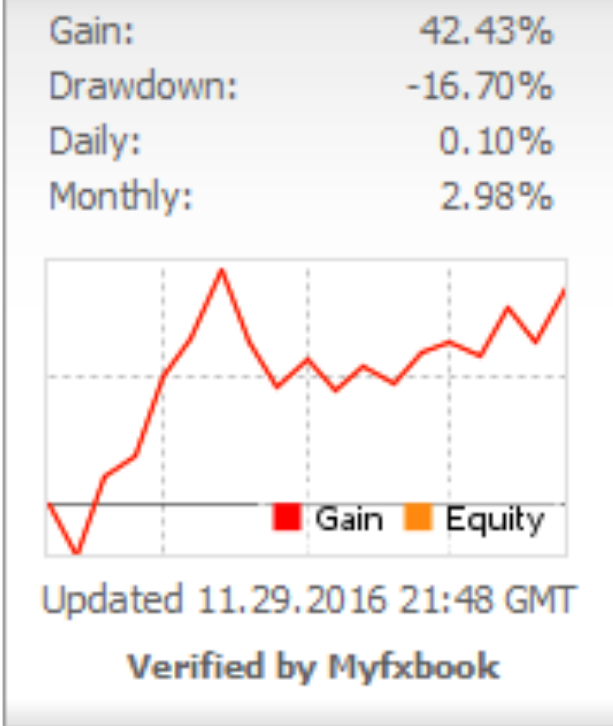
The new Trading Strategy builds on the previous strategy that targeted 100 to 200 Pips over 7 Days and which provided Annual Returns of 40% on average - a performance which beat that of most of the Top 10 Currency Traders as ranked by BarclayHedge.
RATE OF RETURN 2015

RATE OF RETURN 2016
However, despite this strong performance, the limited range of price movement that has now affected most currencies has led to the need to target smaller Pip Ranges each week. With a greater number of these setups availabke to be captured each month, larger and faster Rates of Returns can now be realized.
Creation and Testing of Strategy
To ensure that this new strategy could be sustainable over the long-term, all of 2017 was dedicated to creating and testing a strategy that would have a robust set of parameters and trading rules. This would ensure it could stand up to the strict statistical analysis by Myfxbook


and meet the following criteria for a Real World Trading Strategy;
2. DOES NOT REQUIRE ECONOMIC ANALYSIS
3. DOES NOT REQUIRE MONITORING OF THE TRADE
4. REQUIRES ONLY A HANDFUL OF QUALITY TRADES
5. KEEPS YOUR CHARTS CLEAN & INDICATOR-FREE
6. OFFERS STRONG MONTHLY RETURNS OVER THE LONG-RUN
Having completed this period of extensive research and backtesting to meet these goals, conformation of the viability of the strategy came when it provided a 28% Rate of Return in the December Trader Contest with Dukascopy Bank - in line with the new monthly targets of the strategy.
SUMMARY OF PERFORMANCE

(Check out this blog post for more details of this contest performance that was aimed at testing the strategy - not winning the competition. https://drfxtrading.blogspot.com/2017/12/28-monthly-return-can-put-you-in-charge.html?q=A+28&m=1)
This now sets the stage for what can be expected of my Tracked & Verified Live Account over the next 6 Months starting in February.
CURRENT RETURN - FEBRUARY 2017

Risk Capital Per Trade
For conservative traders who apply a Risk of up to 2% Per Trade to my Trading Signals, the strategy aims to provide a Return of up to 14% Per Month. For the aggressive Retail Traders who use up to 4% Per Trade, gains of up to 30% can be realized...
CONSERVATIVE TRADING TARGETS
 |
| (Assumes average number of trades of 7 per month.) |
AGGRESSIVE TRADING TARGETS

Once the aggressive Retail Trader is able to earn this type of Return each month, even larger trading gains can be achieved from this Trillion Dollar Market in just a few months.

The Main Tools of the Swing Trading Strategy
The Trading Strategy uses accurate Candlestick Patterns, Trend Lines and Consolidation Setups of the Daily and 4 Hour Charts to Accurately Forecast Market Direction and target High Probability Setups each week. Stop Losses of 40 Pips on average are used for each trade, using the strongest areas on the 4 Hour Chart to protect the trade.
After experimenting with various Statistical Indicators across all time frames for several years, I finally discovered that there were certain combinations of Japanese Candlestick Patterns that offered more reliable Entry Signals, especially when combined with the correct way of drawing Trend Lines and the "Best-Fit" Method of identifying Consolidation Setups. When this is done within the framework of strict Trading Rules and Guidelines from the Trading Manual, larger returns are possible for us Retail Traders each month.
Stop Loss Placement
To protect the trade over the 24 Hour Holding Period against temporary pull backs, the following areas on the 4 Hour Chart are used for our Stop Losses
- Strong Trend Lines
- The Support/Resistance of Consolidations
- The Low/High of Candlestick Formations
These are the only areas deemed strong enough to protect trades until the trade targets are hit. If these are not present on the 4H, the trade will be deemed too risky and will be foregone to avoid losses.
The Holding Period & Trade Exit Rules
What I discovered was that in 90% of the scenarios in which the High Probability Setups offered stable 50-70 Pip moves, they didnt need more than 24 Hours on average to hit these targets. Any longer than this usually meant that the market was beginning to slow down and that a reversal was imminent. This is why as one of the rules of my strategies, any trade that has not hit its target within this fixed period will always be closed. This is done to avoid the bad habit of becoming greedy or needy and more importantly to avoid severe trade losses from sharp reversals.
Trading Frequency
On average, there are 1 to 2 of these High Probability Setups that arise each week. This means that with an average time of 3 to 7 days between trades, you will not have to be tied to your computer screen everyday and will have time to recover from both the euphoria of a good trade as well as the disappointment of a loss. This ensures that you can remain objective for your next trade without being overconfident or wanting to exact revenge on the market that took away our money.
Market Setups Traded
Due to the narrow range of currency movements that we see each month, more Consolidation Setups have been formed across Currency Pairs with very few of them providing stable and reliable breakout opportunities as they had in the past. This is why my trading is done strictly within the Consolidation Setups formed on the Daily and 4 Hour Charts.
Consolidations that have a minimum distance of 150 Pips and a maximum of 400 Pips between Support and Resistance are the ones that are traded. These allow us to comfortably capture our trading targets within these wide ranges, while not having to wait too long for these gains to be realized.
Consolidations that have a minimum distance of 150 Pips and a maximum of 400 Pips between Support and Resistance are the ones that are traded. These allow us to comfortably capture our trading targets within these wide ranges, while not having to wait too long for these gains to be realized.
Higher vs Lower Time Frames
Higher Time Frames in general were found to be more reliable with fewer False Signals and "Whiplashes" compared to the 1 Hour and lower charts. With this in mind, the Daily and 4 Hour Charts were then chosen as the time frames to use because they offer the best combination of the following factors that we all look for in a profitable strategy
- Reliable Signals & Stable Patterns
- Strong & Reliable Stop Loss Areas
- Manageable Stop Loss sizes
- Setups with a High Probability of Success
-Trading Targets with Small Holding Periods
Trading Platforms
The Strategy uses the Candlestick Patterns and Signals from FXCM platforms which uses the New York Close of the Daily Candlestick Signal - crucial to trading strategies such as mine.
THE FXCM TRADING PLATFORM
 |
| Although other Platforms use the New York Close Candle, for some reason the FXCM platform seems to provide the most reliable version of the Candle. |
Once the FXCM Signals are provided by the Daily and 4 Hour Charts, the Entry Price, Stop Loss and Limit Order are then executed on my Live FXPRO Account...
LIVE ACCOUNT FXPRO PLATFORM
 |
| The Entry Price, Stop Loss and Limit Order information you receive from me can be executed on the Trading Platform of your choice. I use FXPRO because you can see the exact Risk and Return Percentages before each trade. You also receive email alerts when trades are closed so that you dont have to constantly check your charts. |
So each Trading Signal you receive will be based on the FXCM Charts and the result of each trade will be shown both privately to DRFX Subscribers and here on my blog using the FXCM Charts and my Live Account Charts.
Trading Signals
Once a profitable Swing Trading opportunity is identified, you will be sent the FXCM Chart showing the overall setup and expected market direction.
4 HOUR CHART

You will also be provided with the explanation and theories behind the trade using the relevant section of the Manual. This trade was based on the theory of Consolidations from the Trading Manual, which shows us how to spot and trade the formation of Consolidations...
PAGE 119 OF TRADING MANUAL

The Chart Analysis Sheet in the Manual that is used to ensure that the trade meets all the relevant criteria will also be given to you.
CHART ANALYSIS SHEET

Once it is determined that the trade can be taken, the Trade Entry Sheet with the necessary instructions and price information is filled out and sent for you to execute the trade on your preferred platform.
TRADE ENTRY SHEET

TRADE RESULT

Economic & Financial News
As a former Central Bank Economist with a Masters in Economics, I can state categorically that a knowledge of Economics or Financial Markets is NOT necessary to successfully trade the Forex Market.
Yes it is true that many strategies out there successfully use Economic Data to predict market direction and that knowledge of various Economic Variables is crucial to the conduct of Monetary and Exchange Rate Policies. However, at the Retail Trader level that targets short moves within 24 hours, finding accurate Candlestick Signals was found to be more reliable than using short -term economic data that is too volatile to be used in a meaningful way.
In addition, what you will notice is that whenever there is a major news release during the day, the Candlestick Signal formed on the Larger Charts will eventually reflect the overall reaction by the market to the news. This means that you can simply wait for this Candle to close to indicate where the market is headed and then trade accordingly - without having to play the guessing game with these releases on the smaller charts. The trading gain on the NZD CHF just ahead of the Swiss National Bank Shocker of January 2015 was the best example of Candlestick Patterns providing profitable trades and identifying exit points ahead of market reversals even in the context of extreme financial turmoil (see "New Year off to a Flying Start - 231 Pips and 194 Pips on NZD CHF Trade" in the archives of this blog- Januay 8th, 2015).
OVERALL BENEFITS OF STRATEGY____________________________________________


________________________________


________________________________
ENJOY TRADING WITH THE 24-HOUR SWING TRADING STRATEGY
________________________________

________________________________
TAKE ADVANTAGE OF STRESS-FREE, INDICATOR-FREE TRADING
________________________________


________________________________
EXPERIENCE FORECASTING ACCURACY BEYOND THE COMPETITION
________________________________

________________________________
ENJOY THE BENEFITS OF A PATIENT APPROACH TO MAKING MONEY
________________________________

________________________________
GET STARTED ON YOUR JOURNEY TO FOREX SUCCESS TODAY
________________________________

________________________________


________________________________
________________________________
Contact Me for Technical Details of the Strategy & Your Subscription Service Invoice Today!
All Payment Types Processed by PayPal.

Bank Transfer Also Available.
Duane Shepherd
(M.Sc. Economics, B.Sc. Management and Economics)
Currency Analyst/Trader
shepherdduane@gmail.com /(876)-3825648
Twitter: @WorldWide876
Facebook: DRFXTRADING
________________________________
________________________________


Comments
Post a Comment