ACCURATE USD JPY FORECAST WITH BULL CROWN SETUP MAKES ECONOMIC ANALYSIS OBSOLETE
Despite the popularity of Fundamental Announcements and Economic Analysis in Forex Trading Forecasting, Candlestick Patterns have proven to be a lot more accurate at predicting market moves, especially when used on the Daily and 4 Hour Charts. As evidence of this, the Charts below show the 4H Chart Setup on the USD JPY last week where I accurately predicted the rally between Thursday and Friday using the theory of Bull Crown Setups, without paying attention to the upcoming Non-Farm Payroll Data from the United States. What this means is that even if you do not have a background in Economics or Finance, you can still be successful in Forex Trading once you have the right Technical-Based Trading Strategy.
________________________________________
SPECIAL OFFER
 |
(Email me 10 Examples of Bull Crowns from the Forex by January 10, 2017 and you can enjoy these discounts) |
________________________________________
THE USD JPY FORECASTING ANALYSIS
As you can see, the pair was in the process of forming a Consolidation Pennant Setup, having already formed a Resistance Boundary a few days earlier. It was now in the process of forming the 2nd Support Point that would complete the Support Boundary and the overall Pennant Setup.
4 HOUR CHART MARKET SETUP-FORMING A PENNANT

To complete this expected move back to Resistance, the pair formed a Bull Crown/Inverted Head & Shoulders Pattern after breaking the Downtrend Line to start this rally on Thursday at 9am Eastern Standard Time...
4 HOUR CHART BULL CROWN SETUP

From the Trading Manual below, you can see a typical example of a Head & Shoulder/Crown Pattern often formed ahead of Trend Reversals in setups like these...
TRADING MANUAL - HEAD & SHOULDERS/CROWN PATTERNS

THE 4 HOUR CHART RALLY

Within just 24 Hours - if we are patient enough - the market provided us with opportunities to trade this rally as was predicted, to capture our trading gain in sync with our preferred trading strategies.
FUNDAMENTAL ANNOUNCEMENTS
With many Fundamental News Releases that are expected to have a "major" impact on the market, many traders often avoid the market because of the increased uncertainty of market direction. This would include the Non-Farm Payroll Labour Market Data for the US that was coming on Friday...

However, as you saw from the rally that actually took place, there was no major erratic movement that in anticipation of, during or after the news release. So instead of fearing these types of data, we only need to identify the accurate Candlestick Signals on the Larger Charts that are more indicative of market direction - and trade them according to the rules of our strategies - regardless of the presence of unreliable Economic Data.
________________________________
Forecasting Accuracy you can enjoy Every Week by Subscribing to my World Class Mentoring Service.
________________________________

________________________________

________________________________
THE TRADING STRATEGY & MENTORING SERVICE
The Graph below illustrates the Aggressive 24 Hour Strategy that I use on my Live Account which takes advantage of the ability to accurately forecast the Weekly Range of Exchange Rate Movements of Currency Pairs using the Larger Time Frames.

There are times when trades that offer less than 50 Pips or more than 70 Pips are also targeted, so long as the setup is strong enough to justify taking the risk. All trades are held for a maximum of 24 Hours since this was discovered to be the time needed for the High Probability Trades to hit their Pip Targets. It also imposes a level of discipline that prevents us from being greedy.
Rate of Return Targets
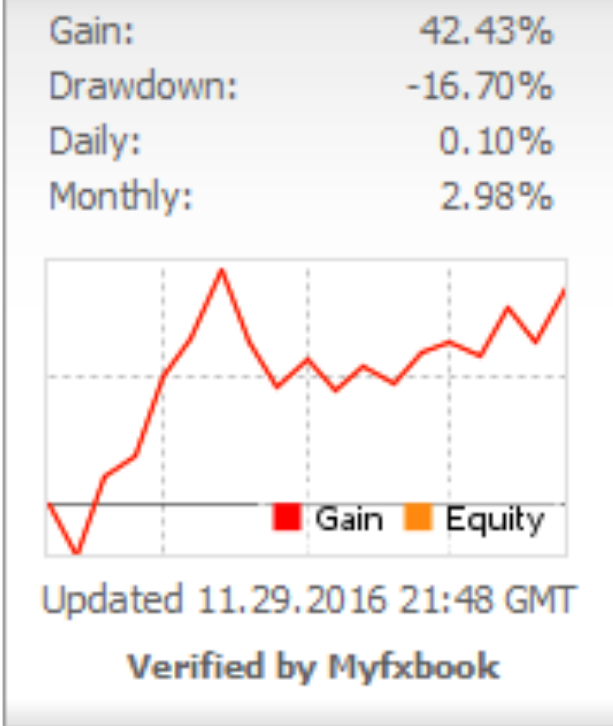
The new Trading Strategy builds on the previous strategy that targeted 100 to 200 Pips over 7 Days and which provided Annual Returns of 40% on average - a performance which beat that of most of the Top 10 Currency Traders as ranked by BarclayHedge.
RATE OF RETURN 2015

RATE OF RETURN 2016
However, despite this strong performance, the limited range of price movement that has now affected most currencies has led to the need to target smaller Pip Ranges each week. With a greater number of these setups availabke to be captured each month, larger and faster Rates of Returns can now be realized.
Creation and Testing of Strategy
To ensure that this new strategy could be sustainable over the long-term, all of 2017 was dedicated to creating and testing a strategy that would have a robust set of parameters and trading rules. This would ensure it could stand up to the strict statistical analysis by Myfxbook


and meet the following criteria for a Real World Trading Strategy;
2. DOES NOT REQUIRE ECONOMIC ANALYSIS
3. DOES NOT REQUIRE MONITORING OF THE TRADE
4. REQUIRES ONLY A HANDFUL OF QUALITY TRADES
5. KEEPS YOUR CHARTS CLEAN & INDICATOR-FREE
6. OFFERS STRONG MONTHLY RETURNS OVER THE LONG-RUN
Having completed this period of extensive research and backtesting to meet these goals, conformation of the viability of the strategy came when it provided a 28% Rate of Return in the December Trader Contest with Dukascopy Bank - in line with the new monthly targets of the strategy.
SUMMARY OF PERFORMANCE

(Check out this blog post for more details of this contest performance that was aimed at testing the strategy - not winning the competition. https://drfxtrading.blogspot.com/2017/12/28-monthly-return-can-put-you-in-charge.html?q=A+28&m=1)
This now sets the stage for what can be expected of my Tracked & Verified Live Account over the next 6 Months starting in February.
CURRENT RETURN - FEBRUARY 2017

Risk Capital Per Trade
For conservative traders who apply a Risk of up to 2% Per Trade to my Trading Signals, the strategy aims to provide a Return of up to 14% Per Month. For the aggressive Retail Traders who use up to 4% Per Trade, gains of up to 30% can be realized...
CONSERVATIVE TRADING TARGETS
 |
| (Assumes average number of trades of 7 per month.) |
AGGRESSIVE TRADING TARGETS

Once the aggressive Retail Trader is able to earn this type of Return each month, even larger trading gains can be achieved from this Trillion Dollar Market in just a few months.

The Main Tools of the Swing Trading Strategy
The Trading Strategy uses accurate Candlestick Patterns, Trend Lines and Consolidation Setups of the Daily and 4 Hour Charts to Accurately Forecast Market Direction and target High Probability Setups each week. Stop Losses of 40 Pips on average are used for each trade, using the strongest areas on the 4 Hour Chart to protect the trade.
After experimenting with various Statistical Indicators across all time frames for several years, I finally discovered that there were certain combinations of Japanese Candlestick Patterns that offered more reliable Entry Signals, especially when combined with the correct way of drawing Trend Lines and the "Best-Fit" Method of identifying Consolidation Setups. When this is done within the framework of strict Trading Rules and Guidelines from the Trading Manual, larger returns are possible for us Retail Traders each month.
Stop Loss Placement
To protect the trade over the 24 Hour Holding Period against temporary pull backs, the following areas on the 4 Hour Chart are used for our Stop Losses
- Strong Trend Lines
- The Support/Resistance of Consolidations
- The Low/High of Candlestick Formations
These are the only areas deemed strong enough to protect trades until the trade targets are hit. If these are not present on the 4H, the trade will be deemed too risky and will be foregone to avoid losses.
The Holding Period & Trade Exit Rules
What I discovered was that in 90% of the scenarios in which the High Probability Setups offered stable 50-70 Pip moves, they didnt need more than 24 Hours on average to hit these targets. Any longer than this usually meant that the market was beginning to slow down and that a reversal was imminent. This is why as one of the rules of my strategies, any trade that has not hit its target within this fixed period will always be closed. This is done to avoid the bad habit of becoming greedy or needy and more importantly to avoid severe trade losses from sharp reversals.
Trading Frequency
On average, there are 1 to 2 of these High Probability Setups that arise each week. This means that with an average time of 3 to 7 days between trades, you will not have to be tied to your computer screen everyday and will have time to recover from both the euphoria of a good trade as well as the disappointment of a loss. This ensures that you can remain objective for your next trade without being overconfident or wanting to exact revenge on the market that took away our money.
Market Setups Traded
Due to the narrow range of currency movements that we see each month, more Consolidation Setups have been formed across Currency Pairs with very few of them providing stable and reliable breakout opportunities as they had in the past. This is why my trading is done strictly within the Consolidation Setups formed on the Daily and 4 Hour Charts.
Consolidations that have a minimum distance of 150 Pips and a maximum of 400 Pips between Support and Resistance are the ones that are traded. These allow us to comfortably capture our trading targets within these wide ranges, while not having to wait too long for these gains to be realized.
Consolidations that have a minimum distance of 150 Pips and a maximum of 400 Pips between Support and Resistance are the ones that are traded. These allow us to comfortably capture our trading targets within these wide ranges, while not having to wait too long for these gains to be realized.
Higher vs Lower Time Frames
Higher Time Frames in general were found to be more reliable with fewer False Signals and "Whiplashes" compared to the 1 Hour and lower charts. With this in mind, the Daily and 4 Hour Charts were then chosen as the time frames to use because they offer the best combination of the following factors that we all look for in a profitable strategy
- Reliable Signals & Stable Patterns
- Strong & Reliable Stop Loss Areas
- Manageable Stop Loss sizes
- Setups with a High Probability of Success
-Trading Targets with Small Holding Periods
Trading Platforms
The Strategy uses the Candlestick Patterns and Signals from FXCM platforms which uses the New York Close of the Daily Candlestick Signal - crucial to trading strategies such as mine.
THE FXCM TRADING PLATFORM
 |
| Although other Platforms use the New York Close Candle, for some reason the FXCM platform seems to provide the most reliable version of the Candle. |
Once the FXCM Signals are provided by the Daily and 4 Hour Charts, the Entry Price, Stop Loss and Limit Order are then executed on my Live FXPRO Account...
LIVE ACCOUNT FXPRO PLATFORM
 |
| The Entry Price, Stop Loss and Limit Order information you receive from me can be executed on the Trading Platform of your choice. I use FXPRO because you can see the exact Risk and Return Percentages before each trade. You also receive email alerts when trades are closed so that you dont have to constantly check your charts. |
So each Trading Signal you receive will be based on the FXCM Charts and the result of each trade will be shown both privately to DRFX Subscribers and here on my blog using the FXCM Charts and my Live Account Charts.
Trading Signals
Once a profitable Swing Trading opportunity is identified, you will be sent the FXCM Chart showing the overall setup and expected market direction.
4 HOUR CHART

You will also be provided with the explanation and theories behind the trade using the relevant section of the Manual. This trade was based on the theory of Consolidations from the Trading Manual, which shows us how to spot and trade the formation of Consolidations...
PAGE 119 OF TRADING MANUAL

The Chart Analysis Sheet in the Manual that is used to ensure that the trade meets all the relevant criteria will also be given to you.
CHART ANALYSIS SHEET

Once it is determined that the trade can be taken, the Trade Entry Sheet with the necessary instructions and price information is filled out and sent for you to execute the trade on your preferred platform.
TRADE ENTRY SHEET

TRADE RESULT

Economic & Financial News
As a former Central Bank Economist with a Masters in Economics, I can state categorically that a knowledge of Economics or Financial Markets is NOT necessary to successfully trade the Forex Market.
Yes it is true that many strategies out there successfully use Economic Data to predict market direction and that knowledge of various Economic Variables is crucial to the conduct of Monetary and Exchange Rate Policies. However, at the Retail Trader level that targets short moves within 24 hours, finding accurate Candlestick Signals was found to be more reliable than using short -term economic data that is too volatile to be used in a meaningful way.
In addition, what you will notice is that whenever there is a major news release during the day, the Candlestick Signal formed on the Larger Charts will eventually reflect the overall reaction by the market to the news. This means that you can simply wait for this Candle to close to indicate where the market is headed and then trade accordingly - without having to play the guessing game with these releases on the smaller charts. The trading gain on the NZD CHF just ahead of the Swiss National Bank Shocker of January 2015 was the best example of Candlestick Patterns providing profitable trades and identifying exit points ahead of market reversals even in the context of extreme financial turmoil (see "New Year off to a Flying Start - 231 Pips and 194 Pips on NZD CHF Trade" in the archives of this blog- Januay 8th, 2015).
________________________________
Happy Trading
Your Mentor
Duane
DRFXTRADING
________________________________


THE 3-MONTH SERVICES

________________________________
1. YOU WILL HAVE SPECIFIC RATE OF RETURN TRADING TARGETS
________________________________
 |
| Assumes an Average Risk of 3% Per Trade, trading just a few times per month. You may use the Risk Per Trade you prefer when applying my Trading Signals. |
These are Strong and Realistic Targets that will keep you Focused and Motivated.
________________________________
2. YOU WILL EXPERIENCE TRADING ACCURACY BEYOND THE COMPETITION
________________________________
NZD CHF CONSOLIDATION BREAKOUT IN JANUARY 2015

ACCURATE EXIT AHEAD OF THE SWISS NATIONAL BANK "SHOCKER" - JUST A FEW DAYS LATER
 |
| (See full description of this trade here New Year off to a Flying Start - 231 Pips & 194 Pips on NZD CHF Trade & more Financial Crisis trade results here 200 Pip Targets Still Hit During Financial Crisis ) |
Candlestick Patterns accurately identify the best Trading Targets ahead of both Normal and Abnormal Market Reversals.
________________________________
3. YOU WILL TAKE ADVANTAGE OF STRESS-FREE, INDICATOR-FREE SWING TRADING
________________________________


Instead of using Complicated Statistical Indicators or volatile Economic Data, the more reliable Japanese Candlestick Signals of the Daily and 4 Hour Charts are used to predict and trade the Weekly Direction of Currency Pairs.
________________________________
4. YOU WILL ENJOY TRADING WITH AN AGGRESSIVE 24-HOUR STRATEGY
_______________________________

Despite these great results, a more aggressive strategy is now being used beginning February 1st, 2018.
 |
| (Some Trades - where justified - will use larger Stop Losses) |
________________________________
5. YOU WILL LEARN ABOUT THE WEEKLY RANGES OF CURRENCY PAIRS
________________________________


The First Step in Swing Trading the Forex with me is to accurately predict the Weekly Range Direction of the major Currency Pairs.
All Currency Pairs have Weekly Ranges which is their average Exchange Rate Price Movements expressed in Pips over 5 to 7 Days. Trading is then done in this direction to capture our Pip Targets according to our Swing Trading Strategy.
________________________________
6. YOU WILL LEARN ABOUT TRENDS & THE PATTERNS THAT LEAD TO TREND CHANGES
________________________________

Mastery of Downtrends, Uptrends and Trend Changes will be achieved with a detailed understanding of the Structure of these Market Patterns.
________________________________
7. YOU WILL LEARN HOW TO IDENTIFY CONSOLIDATION BOUNDARIES
________________________________

There are many schools of thought on how to draw Consolidation Support and Resistance Lines. However, the "Line of Best Fit" method is the only way to do this accurately.
________________________________
8. YOU WILL LEARN HOW TO PREDICT & TRADE FALSE CONSOLIDATION BREAKOUTS
________________________________

Instead of losing due to unexpected Consolidation Market Reversals, we can master and profit from them once we understand their Structure and the Candlestick Signals that start them.
________________________________
9. YOU WILL LEARN HOW TO PREDICT THE FORMATION OF CONSOLIDATIONS
________________________________

Once we are able to spot the Bullish and Bearish Waves that form Consolidations, we can trade these waves for large Pip gains instead of waiting until they are completed.
________________________________
10. YOU WILL LEARN TRADING TECHNIQUES THAT HAVE WON CONTEST PRIZES
________________________________


________________________________
11. YOU WILL HAVE A MENTOR WITH A LIVE FOREX ACCOUNT
________________________________


At 7.3% from just 2 trades in February 2018, only a few trades are left to hit the first target of 14% before moving on to the next major targets.
________________________________
12. YOU WILL ENJOY THE BENEFITS OF A PATIENT APPROACH TO TRADING SUCCESS
________________________________

________________________________


________________________________


________________________________

ONE OF THE FREE VIDEO LESSONS AVAILABLE ON MY YOUTUBE CHANNEL & IN TRADING BLOGS
________________________________


________________________________
WHO WILL BENEFIT THE MOST FROM THIS MENTORING SERVICE?
________________________________
Day Traders Looking to Switch to the Stability of the Higher Time Frames
Swing Traders looking for a New Trading Strategy
Japanese Candlestick Traders who want to further master these Powerful Trading Tools
Traders who no longer want to be Handcuffed to their Computers Every Day
Traders patiently focused on their Long-Term Success from this Market
New Traders who want both the Foundation and Advanced Level Knowledge to Understand this Challenging Market
New and Experienced Traders who want to Demo Trade to practice hitting Large Trading Targets before going/returning to Live Trading
Traders who accurately predict Market Direction but cannot decide on the right Pip Targets
Traders who are annoyed at being Stopped Out too early only to see the market continue to their Initial Targets!
Traders who want to avoid the temptation of interfering with their Profitable Trades – that would have closed on their own at a Larger Profit had they not interfered! Yes I’m talking about you!
Traders who want Real Trading Knowledge beyond the Recycled Information readily available to all
Traders who know that there must be a Method to this “ Madness”
Traders who are tired of Learning and Learning and more Learning and want to finally Dominate the Art of Foreign Currency Trading
________________________________
GET STARTED ON YOUR JOURNEY TOWARDS TRADING SUCCESS TODAY
________________________________

THE 3-MONTH SERVICES
Standard Service includes the Trading Manual, Daily Video Lessons, Trading Signals & Daily Trade Support.
VIP Service includes the Standard Package & VIP Mentoring.
________________________________

________________________________
Contact Me for Your Subscription Service Invoice Today!
All Payment Types Processed by PayPal.

Your Mentor
Duane Shepherd


(M.Sc. Economics, B.Sc. Management and Economics)
Currency Analyst/Trader
shepherdduane@gmail.com /(876)-3825648
Twitter: @WorldWide876
Facebook: DRFXTRADING
________________________________
RISK DISCLOSURE
All the information provided in this blog and as part of my Services, including the Trading Manual, Video Lessons, Daily Trade Support and Skype Mentoring represent my opinions on the relationship between Japanese Candlestick Patterns on the Daily & 4 Hour Charts and Exchange Rate Movements.
Although I use this information to execute trades in the Forex Market using my personal funds via a Live Forex Account, the Trading Signals I provide represent what I am about to do on a Demo Account that I also have at FXCM where no money is used and therefore where no investment can take place.
I do not provide Investment Advice and therefore my Trading Signals and my opinions about the Forex are intented to be executed on Demo Accounts.
Essentially, I am a Live Account Forex Trader who teaches you how to trade on a Demo Account. You can then use your performance on your Demo Account to enter Demo Account Trading Contests to win prize money, apply for Trading Jobs or use it when consulting with a Licensed Investment Advisor to decide if trading on a Live Forex Account is appropriate for you.
TRADING IS NOT FOR EVERYONE. TRADING FOREX INVOLVES HIGH RISKS AND THE POTENTIAL TO LOSE ALL OF YOUR TRADING CAPITAL
Trading foreign exchange on margin carries a high level of risk and may not be suitable for all investors. Before deciding to use my material on a Live Account, you should speak to a Licensed Investment Advisor, carefully consider your investment objectives, level of experience and risk appetite. You can lose all of your invested capital.
There is considerable exposure to risk in any off-exchange foreign exchange transaction, including, but not limited to, leverage, creditworthiness, limited regulatory protection and market volatility that may substantially affect the price, or liquidity of a currency or currency pair.
Market Opinions
The content provided by drfxtrading.blogspot.com is for educational purposes only.
No information presented constitutes a recommendation by drfxtrading.blogspot.com to buy, sell or hold any security, financial product or instrument or to engage in any specific investment strategy.
Any opinions, news, research, analyses, prices, or other information contained on this blog are provided as my opinion of how Exchange Rates move in accordance with Japanese Candlestick Patterns and do not constitute investment advice.
Drfxtrading.blogspot.com will not accept liability for any loss or damage, including without limitation to, any loss of profit, which may arise directly or indirectly from use of or reliance on such information on a Live Forex Account.
YOU are fully responsible for any investment decisions you make. Such decisions should be based solely on your evaluation of your financial circumstances, investment objectives, risk tolerance and liquidity needs.
You should NOT rely solely upon the information or opinions that you read on the blog or receive via my Services. Rather, you should use what you read and receive as a starting point for doing your own independent research, your own independent analysis, and refine your own trading methods before placing your money at risk.
Internet Trading Risks
There are risks associated with utilizing an Internet-based deal execution trading system including, but not limited to, the failure of hardware, software, and Internet connection. Since drfxtrading.blogspot.com does not control signal power, its reception or routing via Internet, configuration of your equipment or reliability of its connection, I cannot be responsible for communication failures, distortions or delays when trading via the Internet.
Accuracy of Information
The content on this website is subject to change at any time without notice and is provided for the sole purpose of assisting traders to make independent investment decisions.
drfxtrading.blogspot.com has taken reasonable measures to ensure the accuracy of the information on the blog.
However, drfxtrading.blogspot.com does not guarantee its accuracy, and will not accept liability for any loss or damage which may arise directly or indirectly from the content or your inability to access the blog, for any delay in or failure of the transmission or the receipt of any instruction or notifications sent through this website.
Distribution
This blog is not intented for distribution or use by any person in any country where such distribution or use would be contrary to local law or regulation.
None of the Services offered are to be used by persons from a country where the provision of such services would be contrary to local law or regulation.
It is the responsibility of visitors to this blog and users of my Services to ascertain the terms of and comply with any local law or regulation to which they are subject.
__________________________________


This comment has been removed by a blog administrator.
ReplyDelete