USD CHF - 100s OF PIPS BULLISH OR BEARISH?
Hundreds of Pips in either direction appear to be possible for the next few weeks if we see strong Bullish or Bearish breakout signals. The Weekly Range has recently been hit after a very long and slow trend and has now settled above a major Downtrend Line. A convincing Bullish Candle break above Resistance would put the 0,9400 area in play, while a break short to also take out the Uptrend Line would make 0,8700 the long-term bearish target.
The currency pair has started to move within a small Range above the Inner Uptrend Line, following a rally to the 0,9100 area.
DAILY CHART
The gains for the Swiss Franc also put the pair above a major Outer Trend Line of a previous Downtrend.
DAILY CHART
As you can see, the recent uptrend was part of a break from the Inner Trend Line to the Outer Trend Line of that Downtrend. From this point, the market could either break higher for an even stronger Uptrend or break lower to resume the overall Downtrend. In continuing higher, the Daily Chart would first have to break the Resistance of its current Range setup.
DAILY CHART
The first major target would be the next Weekly Range which would be at the 0,9435 area. Short-term targets will be hit along the way as traders exit profitable positions in this new uptrend. Equally profitable targets could also be hit going short if there is a breakout bearish from this Range along with a break of the Outer Uptrend Line.
DAILY CHART
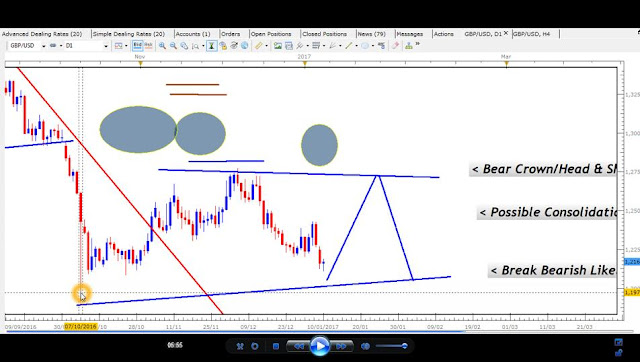
Before breaking bearish, the currency pair could actually spend a little longer in this Range to carry it closer to the Outer Trend Line. At times, trend changes that involve Consolidation breakouts tend to take place simultaneously with Trend Line breaks to make the start of the new trend even more convincing (TRADE TIP).
See how the concept of the Weekly Range and Consolidation breakouts worked on past trades in the Free Preview of the Trading Manual;
RECENT EMAIL FROM CLIENT
____________________________________________________
SUBSCRIBE TODAY


Comments
Post a Comment