NZD JPY- BULLISH SIGNAL NEEDED FOR LARGE GAINS
Consolidation, Consolidation and more Consolidation. When will they end? Only the policy makers at the major Central Banks and the key market players know the answer. Until then, our responsibility as traders of the Larger Time Frames is to accurately spot them, analyze them and trade them for large gains. We do this by using the trading rules established for trading these patterns in my Trading Manual and waiting patiently until our targets are hit.
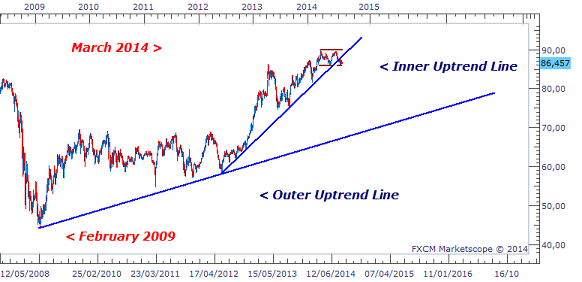
The next major setup that could provide such an opportunity is on the NZD JPY. This has been moving sideways towards the major Inner Uptrend Line following the end of a very long 5 -year rally.
DAILY CHART
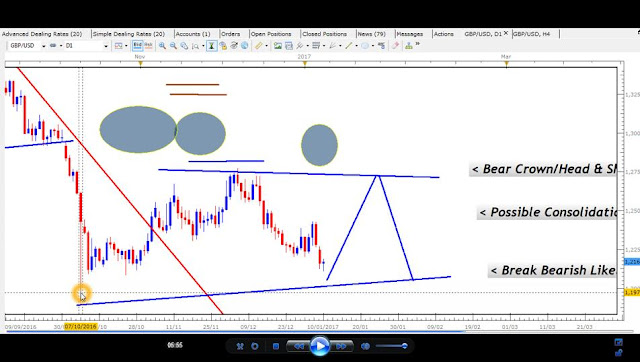
The sideways movement can be seen more clearly on the next chart where a Range setup appears to be taking shape.
DAILY CHART
This 390-Pip Range would be completed with a rally to the Resistance boundary. A few hundred pips would be ours for the taking if we see a strong Bullish signal above the Downtrend Line (DTL) and the Counter Trend Line (CTL).
DAILY CHART
Once this appears, we can enter immediately with the appropriate Stop Loss and Limit Orders, using the Daily and 4 Hour Charts. The exact size of these Risk and Reward parameters will depend on the patterns formed when the signal appears, so long as they are within our limits set out in our Excel Worksheet.
Take full advantage of the low market volatility by maximizing on these large Consolidation setups. Trade them on your own using the guidelines established in the Trading Manual or execute them directly from my Trade Setup emailed to you as a Subscriber.
RECENT EMAIL FROM CLIENT
____________________________________________________
SUBSCRIBE TODAY


Comments
Post a Comment