GBP USD WEEKLY ANALYSIS
STERLING SHOWING INDECISION
Based on the Weekly Chart´s direction and position above the Resistance area, there appears to be a bias towards the continuation of the uptrend However, the recent downtrend and uptrend waves on the Daily Chart, suggest a bearish turn is possible.
DAILY CHART

There have been two recent waves on this chart that look to be the type that lead to a consolidation formation (details in Trade Manual). The bearish wave on the left-hand side of the chart created Resistance and Support prices of 1,6821 and 1,6458, respectively. This was then followed by an uptrend back up to that Resistance area where we now have candles with Tweezers/Wicks that indicate a U-turn bearish is likely. Confirmation will come from a break of the uptrend lines, leading to another downtrend and a possible trading gain of 200 pips if taken.
RECENT EMAIL FROM CLIENT
The sideways movement of the GBP USD in recent months points to a significant amount of indecision about the long-term direction of the pair. The Weekly Chart shows that there is a bit of a struggle to break beyond the Resistance of a large Pennant on the Monthly Chart, while the Daily Chart looks poised to continue the sideways dance for the time being.
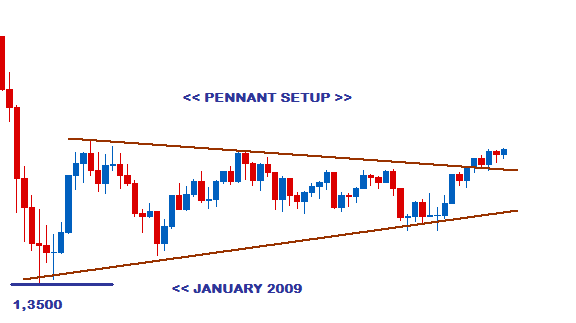
The chart below shows the large Monthly Pennant setup that was formed after the period of risk-aversion in 2008 during the Financial Crisis that led to sharp gains for the USD. When the sell-off ended at the beginning of 2009, waves of uptrends and downtrends combined to form the current consolidation pattern.
MONTHLY CHART
The latest uptrend wave in this consolidation has taken us to just above the Resistance, where we see the pair moving sideways, indecisively.
WEEKLY CHART
Based on the Weekly Chart´s direction and position above the Resistance area, there appears to be a bias towards the continuation of the uptrend However, the recent downtrend and uptrend waves on the Daily Chart, suggest a bearish turn is possible.
DAILY CHART

There have been two recent waves on this chart that look to be the type that lead to a consolidation formation (details in Trade Manual). The bearish wave on the left-hand side of the chart created Resistance and Support prices of 1,6821 and 1,6458, respectively. This was then followed by an uptrend back up to that Resistance area where we now have candles with Tweezers/Wicks that indicate a U-turn bearish is likely. Confirmation will come from a break of the uptrend lines, leading to another downtrend and a possible trading gain of 200 pips if taken.
RECENT EMAIL FROM CLIENT
____________________________________________________
SUBSCRIBE TODAY
_____________________________________________________________


Comments
Post a Comment