2.0% GAIN ON GBP USD AS WE TOOK ADVANTAGE OF SHARP DOWNTREND
With this trade, the Rate of Return since the Methodology started in February this year is now at 21.59%. Despite the initial loss and assuming the next set of trades provide average returns of 4.0% each, only 3 trades will be needed to hit the 30% target followed by just 5 to hit the 48% target!
TRADE SUMMARY AND RESULT
RATE OF RETURN
TRADING PLATFORMS
________________________________
OVERVIEW OF THE TRADE SETUP OCTOBER 18TH, 2018
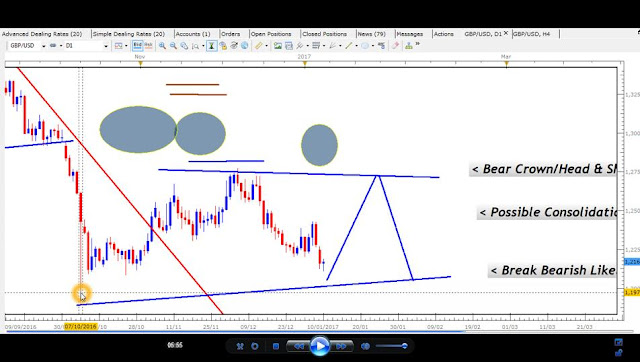
The Daily Chart appeared to be forming a Consolidation Setup and had recently started a downtrend with Double Tops and a Strong Bearish Candle. This provided an opportunity to trade the expected decline as it headed towards the major Support Price Point at 1.2921.
DAILY CHART OCTOBER 4TH, 2018
________________________________
The overall Setup and Signal were both considered to be strong enough to justify the trade. Entry took place at the close of that Daily Candlestick Signal, with the Stop Loss placed above the Downtrend Line on the 4 Hour Chart. An email to my Subscribers was then sent explaining the reasons and the theories behind the trade, along with the graphs, Entry, Stop Loss and Limit Orders.
4 HOUR CHART TRADE SETUP OCTOBER 18TH, 2018
However, instead of heading towards the target, the market pulled back aggressively to take out the Stop Loss.
The FXCM Demo Account above is used for my analysis and Signals (better charts) but my Live Trades are done with FXPro (exact Risk and Return Values in Percentages for each trade provided as well as email alerts).
Despite this reversal that took place, the overall trend was still bearish on the Daily Chart. It was therefore no surprise that the market became bearish once more on the 4 Hour and provided another Entry Signal in the form of a Counter Trend Line Break Bearish Signal. Stop Loss was placed above the Downtrend Line once again and after another temporary pullback, the Support Point and our trading target were hit.
INITIAL TRADE RESULT
The FXCM Demo Account above is used for my analysis and Signals (better charts) but my Live Trades are done with FXPro (exact Risk and Return Values in Percentages for each trade provided as well as email alerts).
Despite this reversal that took place, the overall trend was still bearish on the Daily Chart. It was therefore no surprise that the market became bearish once more on the 4 Hour and provided another Entry Signal in the form of a Counter Trend Line Break Bearish Signal. Stop Loss was placed above the Downtrend Line once again and after another temporary pullback, the Support Point and our trading target were hit.
Now here is where it got interesting. My trades are done on both the FXCM Demo and my Live FxPro Account. However, due to the wider spread on the Demo Account, the Stop Loss was not triggered and the trade was still open when the new signal was given! So while some of us incurred a loss, the FXCM Demo and those who had platforms with wider Spreads eventually captured the initial target of 93 Pips!
Although this small difference in Pip Spread was the cause, I believe that the real mistake was on my part. Instead of placing the Stop Loss above both the Trendline AND the High of the Candle as I normally do (as was done for the 2nd Entry and the previous NZD JPY trade), it was placed only above the Trendline. This therefore left it more exposed to these types of temporary reversals that lead to unnecessary losses.
Fortunately, given the size of the Downtrend that was taking place, it offered a 2nd chance at capturing gains to compenste for the loss, before the trend ended. It is also one of the main advantages of the larger ranges of movements provided by the Larger Time Frames of the Daily and 4 Hour Charts.
Your Mentor
Duane Shepherd
Currency Analyst/Trader
shepherdduane@gmail.com /(876)-393 3355
Twitter: @WorldWide876
________________________________
There are many well-intentioned Forex Courses and Mentors globally. However, most fall short of the mark in terms of what you really need to take advantage of the Forex because of the limited Testing and Research that went into creating their Systems.
This is why they only work in the Short-Term.
To correct this, you need to have a totally new approach from the ground level with theories that have been extensively tested for 10 years, during both Normal and Abnormal market conditions.
This is what you will finally get as a DRFX Subscriber.


Comments
Post a Comment