65-PIP GAIN ON CAD JPY PUSHES RETURN TO 13.0% IN JUST 4 MONTHS!
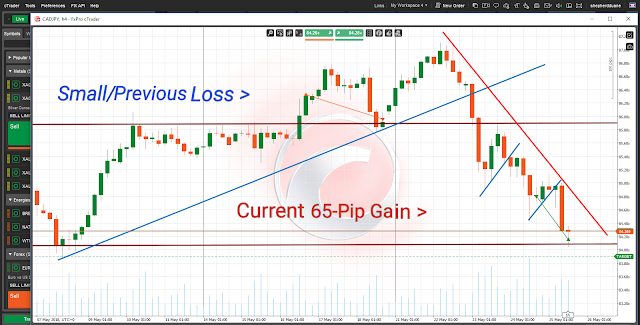
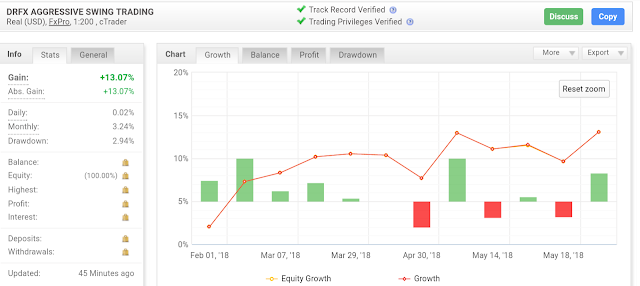
Following a couple of small losses over the last few weeks, the recent 65-Pip gain on the CAD JPY has pushed the Rate of Return to 13.06% from just 12 trades - placing us just a few trades away from hitting the 14% and 30% targets in the next few weeks!
TRADE STRATEGY AND TRADING THEORIES USED
This trade was based on the strategy of targeting 50 to 70 Pips Per Trade within 24 Hours.
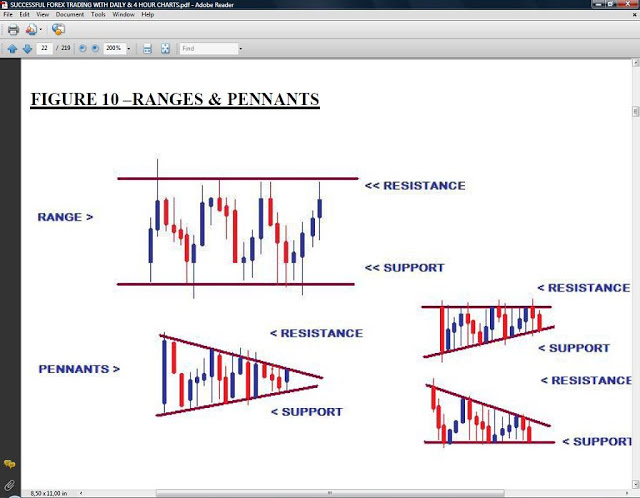
The trade took advantage of the Technical Theories of Japanese Candlesticks, Consolidations and Trend Lines from my Trading Manual (included in your Subscription to my Services - see Website for details) that allow us to accurately forecast and take advantage of major price movements each week.
MAIN HIGHLIGHTS OF THE TRADE
1. False Breakout Reversals lead to fast movements back inside of Consolidation.
2. Trading Targets can be set at the opposing boundary.
3. Targets take a shortwhile to hit their targets.
4. 4 Hour Chart Trend Lines and Support/Resistance Boundaries can protect your trades against temporary pullbacks.
5. Never Watch your trades to avoid the temptation of unnecessary interference because of minor/ temporary reversals.
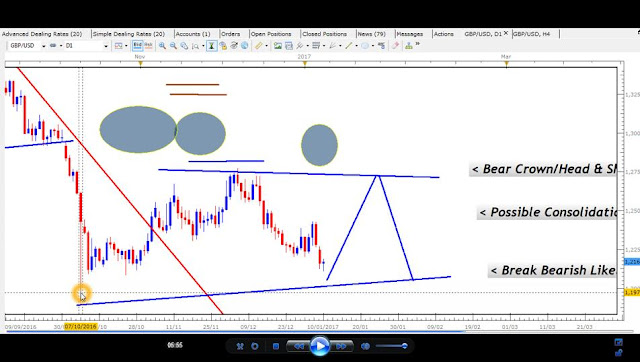
THE THEORY OF CONSOLIDATION SETUPS
CAD JPY TRADE SUMMARY
TRADE SUMMARY & ALERT FROM FXPRO
SUMMARY OF TRADES
RATE OF RETURN
The graphs below for 2015 and 2016 show the average Annual Rates of Return using the 100 to 200 Pip Strategy.
HISTORICAL RATES OF RETURN
With the addition of the new 50 to 70 Pip Strategy...
SUMMARY OF RETURNS
The graphs below for 2015 and 2016 show the average Annual Rates of Return using the 100 to 200 Pip Strategy.
HISTORICAL RATES OF RETURN
With the addition of the new 50 to 70 Pip Strategy...
...Larger and Faster Returns are now targeted.
RATE OF RETURN TARGETS
TRADE STRATEGY AND TRADING THEORIES USED
This trade was based on the strategy of targeting 50 to 70 Pips Per Trade within 24 Hours.
MAIN HIGHLIGHTS OF THE TRADE
1. False Breakout Reversals lead to fast movements back inside of Consolidation.
2. Trading Targets can be set at the opposing boundary.
3. Targets take a shortwhile to hit their targets.
4. 4 Hour Chart Trend Lines and Support/Resistance Boundaries can protect your trades against temporary pullbacks.
5. Never Watch your trades to avoid the temptation of unnecessary interference because of minor/ temporary reversals.
DAILY CHART FALSE CONSOLIDATION BREAKOUT REVERSAL
DAILY CHART DECLINING AS PREDICTED TO SUPPORT
4 HOUR CHART ENTRY SETUP
TRADING TARGET HIT
THE TRADING MANUAL
DAILY CHART DECLINING AS PREDICTED TO SUPPORT
4 HOUR CHART ENTRY SETUP
TRADING TARGET HIT
THE TRADING MANUAL
THE THEORY OF CONSOLIDATION SETUPS
________________________________
Your Mentor
Duane Shepherd
Currency Analyst/Trader
shepherdduane@gmail.com /(876)-3825648
Twitter: @WorldWide876
________________________________
There are many well-intentioned Forex Courses and Mentors globally. However, most fall short of the mark in terms of what you really need to take advantage of the Forex because of the limited Testing and Research that went into creating their Systems.
This is why they only work in the Short-Term.
To correct this, you need to have a totally new approach from the ground level with theories that have been extensively tested for 10 years, during both Normal and Abnormal market conditions.
This is what you will finally get as a DRFX Subscriber.


Comments
Post a Comment