Posts

Showing posts from January, 2017

SHARP GBP USD RALLY PREDICTED 7 DAYS AGO
Image
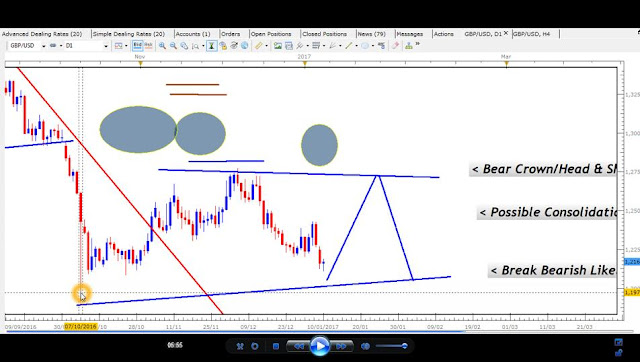
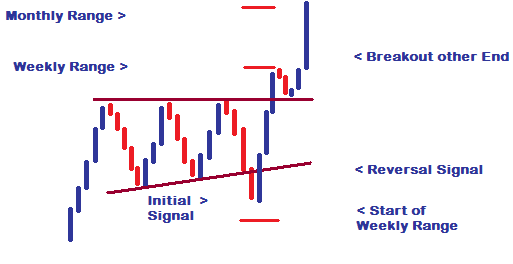
As predicted several days ago, the GBP has rallied sharply above major Support area of 1,2000 to start an uptrend that will take it up to the 1,2750 area by Wednesday January 25th, 2017. This is all part of the predicted  formation of a Consolidation Setup on the Daily Chart. In the screen shot of the Private Video Tutorials sent to DRFX Subscribers (www.drfxswingtrading.com), you can see the blue line used to indicate where I expected the rally. PRIVATE VIDEO LESSON - JANUARY 10, 2017 In the screenshot and Youtube Video below of January 18, you can see that the rally took the form of a strong Bull Candle - exactly where I predicted. PRIVATE VIDEO LESSON JANUARY 18, 2017 This projected Consolidation is based on the type of bullish and bearish waves on the Daily Chart. From the Trading Manual, you will see that there are certain types of waves that tell us when the market will form a Consolidation. ...

QUALITY FOREX SERVICE, CONSISTENT TRADING GAINS

Image
_______________________________ ________________________________ ________________________________ ________________________________ ________________________________ ________________________________ Sounds Good? Contact Me for your Free 10-Day Trial or for  your Subscription Service Invoice Today!  All Payment Types Processed by PayPal. Bank Transfer Also Available. Your Mentor Duane Shepherd ( M.Sc. Economics, B.Sc. Management and Economics) Currency Analyst/Trader shepherdduane@gmail.com /(876)-3825648 Twitter: @WorldWide876 Facebook: DRFXTRADING ________________________________

88 PIIPS FROM FALSE BREAKOUT REVERSAL

Image
The EURO AUD Pair provided a strong Bearish Signal to indicate the reversal back inside of the Daily Chart Range Setup. This appeared following 2 failed attempts to get things going Bullish above Resistance. Based on the theory of False Consolidation Breakouts from my Trading Manual, the expectation was for a profitable reversal from this reversal.... The Chart below shows the Signal given on the Daily Chart at Resistance to start the movement back to Support. DAILY CHART This meant that traders needed to find a way to trade this expected decline quickly, before the opportunity is missed. Looking at the 4 Hour Chart-which is my choice for entry - an Entry Setup came in the form of a breakout from Consolidation. 4 HOUR CHART Instead of using the Resistance, the Stop Loss place above the Trend Line which was strong enough to protect the trade. The target was set to just above the Support. After enterin...
Image
__________________________