ANOTHER FALSE BREAKOUT ON THE EURO USD
Many traders will now be wondering why the 2 strong Bullish Breakout attempts on this pair have been met by sharp Bearish reversals in favour of the USD? The Bull Candle Signals given on the Daily Chart appeared to be strong enough to justify entry and provide sharp EURO gains, yet on each occasion, the Bears took control aggressively to pull us back inside of the Pennant Setup. So are there explanations for these reversals that are all so common across the Forex Market or should we put them down to just being random movements?
The Pennant Setup on the Daily Chart was formed by waves of Uptrends and Downtrends since June of this year. Within the last few weeks, we saw the first attempt to break out of this attempt with a strong Bull Candle at Resistance. However, this was followed up by sharp Bearish Candles that took the pair back inside of the Consolidation.
DAILY CHART- FALSE BREAKOUT SIGNALS
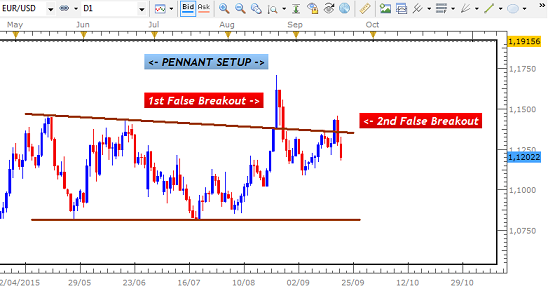
After only managing to reach half-way inside of the Pennant, we saw another attempt to head higher and breakout once more. This was given with a smaller candle signal but a very strong one nonetheless that usually leads to successful breakouts. Yet, once more, the Bulls were taken out by sharp Bearish Candles that have taken us back below the Resistance boundary. Based on this, it is very possible that we see a break to the Support boundary at 1.0815.
DAILY CHART - EXPECTED BREAK TO SUPPORT

These scenarios are very common traps that lead to trading losses. Breaks of Consolidation barriers are usually strong indicators that a profitable move will take place, offering large gains in a very short time. So it is no exaggeration to say that these losses can be surprising and frustrating for traders -especially when the signals are strong.
Based on what I have observed in the market over the years, I have found that there are 3 main categories of Breakout Signals that appear at Consolidations and only 1 of these leads to profitable breakouts. I have also noted that these candles also have to break the Resistance/Support boundary by a large enough distance in order to justify entry.
TAKEN FROM THE TRADING MANUAL
 |
("Successful Currency Trading With the Daily & 4 Hour Time Frames"- Available as part of the Swing Trading Course at www.drfxswingtrading.com) |
The first Candle that attempted the break out is one of those that have a low probability of success and should be avoided. The 2nd Candle is actually one of those that are normally safe to trade but the distance by which it broke the Resistance was not enough. Ideally, more than half of the body of the Candle needs to close beyond the boundary.
DAILY CHART- TYPES OF BREAKOUT SIGNALS

In order to have a correct signal, therefore, the type of candle and the distance of the breakout need to be appropriate. Once you are able to identify these types of Candles and examine if they should be traded based on these and other criteria in the Trading Manual, you will be able to avoid these traps and focus on those that lead to profitable moves.
________________________________


Hi Duane,
ReplyDeleteIt's been a while. How you doing, man?
Let's see how price react around the 1.11 handle, mate.
It's very important, in my own opinion ;)
Hey man, I`m good you?
ReplyDeleteI actually seeing it stall a little below that area at 1.1052 before pulling back once again (The Weekly Range). That pullback will either lead to a small Consolidation or a Counter Trend Line being formed before continuing lower.
Lets see what happens.
Duane
Hey Everybody,
ReplyDeleteBelow is a list of the highest ranking forex brokers:
1. Most Recommended Forex Broker
2. eToro - $50 min. deposit.
Here is a list of money making forex tools:
1. ForexTrendy - Recommended Odds Software.
2. EA Builder - Custom Indicators Autotrading.
3. Fast FX Profit - Secret Forex Strategy.
I hope you find these lists beneficial...