NZD CAD - SHARP FALSE BREAKOUT HEADED TO MAJOR TREND LINE?
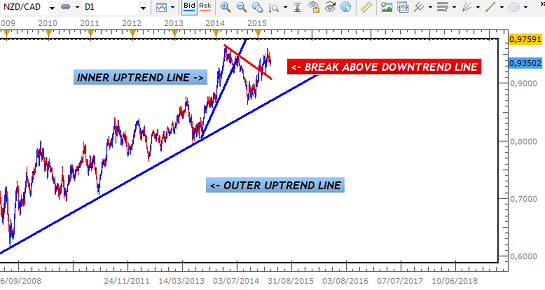
After breaking below its Inner Uptrend Line between June and July of 2014, the pair has since begun a rally above the Downtrend Line that could resume the overall Uptrend. The chart below shows the sharp U-Turn that took place just above its Outer Uptrend Line that led to the break above the Downtrend Line.
DAILY CHART - NZD CAD
In breaking above this Downtrend Line, the pair then started to lose momentum as it formed a Pennant Setup above this boundary. Eventually, there was an attempted rally above Resistance that would have seen the Kiwi resume its gains against the Yen, but this was short-lived. The market become volatile, taking out those Bullish Candles before pulling back inside of the Pennant near the Support.
DAILY CHART - FALSE BREAKOUT

This is in keeping with the theory of False Breakouts and their tendency to move to the other end of the Consolidation.

Given this scenario and the volatile nature of the candles, a larger bearish pullback below the Pennant seems the most likely outcome. Such movements - breaking out at the opposite end of a Consolidation - are also very common following a False Breakout.

If this materializes, we could see a sharp drop down to the Outer Uptrend Line in the weeks ahead.
DAILY CHART-REVERSAL TARGET

As a Swing Trader using Price Action, the next step will be to wait for the appropriate setups and signals as the pair breaks below the Support and the Downtrend Line. Break below this Downtrend Line will provide added confirmation of this direction, providing the confidence required to capture that next 200-Pip trade.
______________________________________________


Comments
Post a Comment