Posts

Showing posts from April, 2015

AUD USD - STRONG RALLY OR FALSE BREAKOUT AHEAD?

Image
The Range Setup on this pair was finally broken with a strong bull candle breakout signal. This signal - a Normal Candle - has also broken the strong Downtrend Line that was formed with the breakout from the large Pennant Setup started in November of 2014. Given these strong bullish technical signals that point to the start of a strong breakout, many traders would be getting ready to capture hundreds of Pips from this expected rally. However, as attractive as this setup is, there a 3 other important, more dominant technical factors that may lead to either a False Breakout or a breakout that is volatile and risky to trade. The breakout candle that was given on Monday April 28 can be seen in the Daily Chart below. DAILY CHART- BREAKOUT SIGNAL From Section 8 of the 2nd Part of the Trading Manual, we can see that this candle which broke above the Resistance, complies with all of the requirements of a Normal Candle that would usually make this a tradeable setup. ...
NZD CAD - SHARP FALSE BREAKOUT HEADED TO MAJOR TREND LINE?

Image
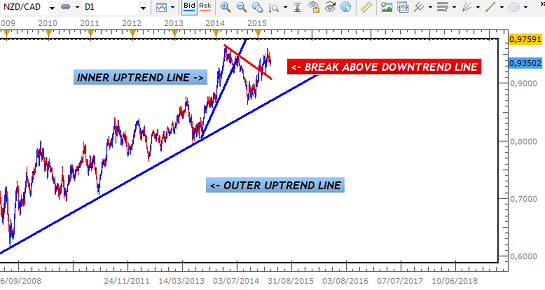
After breaking below its Inner Uptrend Line between June and July of 2014, the pair has since begun a rally above the Downtrend Line that could resume the overall Uptrend.  The chart below shows the sharp U-Turn that took place just above its Outer Uptrend Line that led to the break above the Downtrend Line. DAILY CHART - NZD CAD In breaking above this Downtrend Line, the pair then started to lose momentum as it formed a Pennant Setup above this boundary.  Eventually, there was an attempted rally above Resistance that would have seen the Kiwi resume its gains against the Yen, but this was short-lived. The market become volatile, taking out those Bullish Candles before pulling back inside of the Pennant near the Support. DAILY CHART - FALSE BREAKOUT This is in keeping with the theory of False Breakouts and their tendency to move to the other end of the Consolidation. Given this scenario and the volatile nature of the candles, a larger...

PROJECTED PENNANT FORMED ON EURO USD DAILY CHART - STRONG BREAKOUT AHEAD?

Image
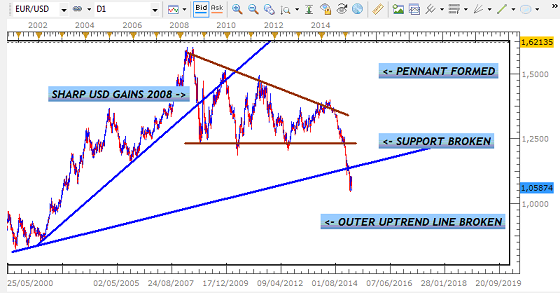
This pair has now formed the predicted Pennant Setup on the Daily Chart and has now resumed the bearish breakout from the larger Pennant Consolidation. There had been an initial Counter Trend Line (CTL) Setup that was broken in an attempt to resume this downtrend, but because of the weak nature of the candles and the subsequent Bullish Candle, a Pennant was forecast to be formed. This tends to happen when CTL breaks are weak and knowledge of this dynamic of the market can be used to avoid pullbacks that can take out trades. GENERAL MARKET PATTERN As can be seen in the chart below, a break out has started from the large Pennant formed in the aftermath of the Financial Crisis and safe-have flows of 2008. DAILY CHART - PENNANT CONSOLIDATION Given the size of this Consolidation and the general theory behind Consolidation Breakouts, the gains for the USD are likely to continue for the rest of the year as we head towards the next major Support of 0.8230. ...

SUBSCRIBERS NOW UP 53% WITH 200-PIP AUD NZD TRADE

Image
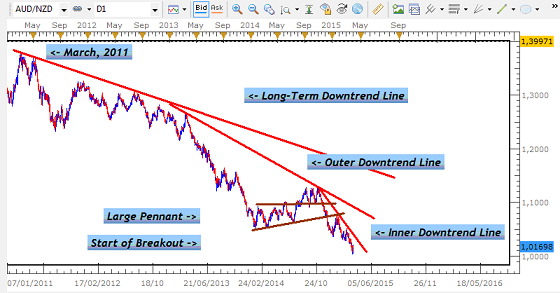
This latest 200-Pip gain involved a Consolidation Breakout trade from a Range setup on the Daily Chart of this Aussie pair. The Support boundary was initial broken with a weak Bearish Candle but was soon followed by a stronger U-Turn Signal that indicated the resumption of the breakout. Having determined that the overall setups on the Daily and 4 Hour Charts were in sync with the Methodology’s criteria, the trade was executed on Sunday March 29, 2015. After only a few days, the target was subsequently hit within the established holding period to push the overall return for Subscribers to 53% from only 12 trades, generating 868 Pips along the way. Apart from the strong trading profit that Subscribers would have enjoyed on their Retail and Institutional Trading Accounts, the sharp Bullish Reversal in the market a day later would have provided them with additional reassurance about the accuracy of the Methodology. With Consolidation Breakouts, there is a greater tendency to hold ou...