800 PIPS ON OFFER FROM GBP USD DECLINE
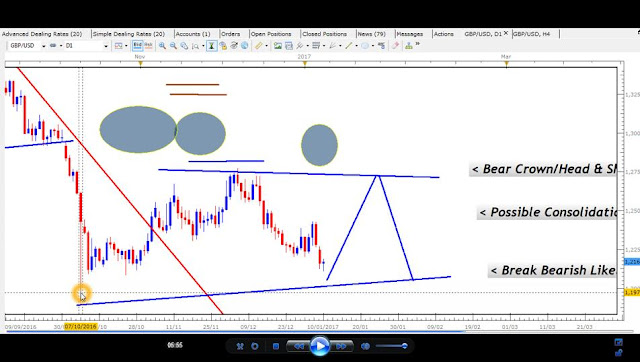
Having formed a small Pennant just below the major Resistance of a larger Pennant, the GBP USD could be headed towards the Support area some 800 Pips away. If we see a strong bearish signal below the Support of this smaller Pennant, traders can expect a big payday in the weeks ahead.
DAILY CHART- LARGE PENNANT
This downtrend has been in place since July this year after forming the high of 1,7190.
DAILY CHART - DOWNTREND
If this downtrend is going to continue, we will need to see a convincing bearish breakout signal following the test of the Support of this smaller Pennant.
DAILY CHART - PENNANT SETUP
Over 800 Pips of profits would be offered during this breakout. Some traders will enter and hold their position for the entire duration of this decline, while most will take gains and re-enter according to their profit goals and holding period constraints. But given that these trends have...
...how do you determine when to enter and where to place your Stop Loss to protect your trade from the natural waves of the market? How do you know which time frame to follow in case the trend starts to reverse unexpectedly before that Support area is hit?
DAILY CHART- LARGE PENNANT
- Formed following the end of the safe-haven buying of US Dollars during the Financial Crisis;
- Has now pulled back to the Resistance of the Pennant following a breakout;
- Could break Support to continue the new Downtrend in favour of the USD to reflect the end of Quantitative Easing;
This downtrend has been in place since July this year after forming the high of 1,7190.
DAILY CHART - DOWNTREND
If this downtrend is going to continue, we will need to see a convincing bearish breakout signal following the test of the Support of this smaller Pennant.
DAILY CHART - PENNANT SETUP
Over 800 Pips of profits would be offered during this breakout. Some traders will enter and hold their position for the entire duration of this decline, while most will take gains and re-enter according to their profit goals and holding period constraints. But given that these trends have...
- False entry signals;
- Pullbacks & small Consolidations;
- Weak Stop Loss areas;
...how do you determine when to enter and where to place your Stop Loss to protect your trade from the natural waves of the market? How do you know which time frame to follow in case the trend starts to reverse unexpectedly before that Support area is hit?
___________________________________________________________
RECENT EMAIL FROM CLIENT
____________________________
GET STARTED TODAY
____________________________
GET STARTED TODAY
____________________________


Comments
Post a Comment