Posts

Showing posts from November, 2014

3-Wave Rule Denies Traders Sharp Gains on GBP CAD

Image
After starting what appeared to be a strong Bearish breakout from its Consolidation setup this week, this pair has now started to pull back sharply Bullish, much to the chagrin of Currency Traders. As surprising as this may have been to some, there was a key Technical Factor at work that was always going to have a hand in this reversal that my traders were aware of - the 3-Wave Rule of trends in the Currency Market. There are generally two types of trends that are seen in this market. They will either be sharp and fast with very few pullbacks or slow and steady with waves of U-Turns along the way. Whenever they take the form of waves as was the case in this Range breakout, they will usually pullback and reverse after 3 of these waves are completed. Following this, the pair will either take a break before resuming the trend or start a new trend in the opposite direction ( Section 9 - “Consolidation Trading on the Forex Market - A Complete System for Illiquid Market Conditions”) . ...

Swing Trading vs Day Trading - Has the Debate Ended?

Image
Within the context of the ongoing debate between Swing Trading and Day Trading, these early results from my Methodology appear to tip scale decisively towards Swing Trading. Only 7 trades have been done so far and to date, the results have already beaten the Year-to-Date returns of 80% of the Top Traders Ranked by BarclayHedge. With only 9 trades left for this strategy to generate a 100% return for my clients (sadly, cost of Manual will go up accordingly- see Table), Day Trading may soon by a thing of the past as you spend less time trading and more time earning. Currency Trading can be a very lucrative means of earning income on a short and long-term basis. The most popular way of doing this by traders has been to profit from the intra-day changes in a currency’s value, during the most liquid trading sessions of the day. However, given the difficulty of consistently modelling the random price behaviour of a financial asset class at this micro level, sustainable success from...

101 PIPS ON AUD NZD - 80% OF TOP TRADERS NOW BEATEN

Image
The latest trading opportunity on the Forex Market provided my clients with a 101-Pip gain on the AUD NZD this week. The pair was shorted as it started to turn at the Resistance of its Consolidation, heading to the Support boundary 250 Pips away. The trade was held for the pre-determined holding period and exited for the latest gain that has now provided clients with 286 Pips from only 6 trades. At a risk per trade of 5%, a trader or investor using my Methodology would now be enjoying a 12,6% return, beating 80% of the Top Currency Traders for 2014 as ranked by BarclayHedge. The pair had formed a Pennant above the Resistance of a larger Pennant following a short-lived breakout attempt in September. DAILY CHART- PENNANT SETUPS As it continued to move within this smaller Consolidation, a Bearish Signal was given at its Resistance to start a small downtrend back to Support. DAILY CHART - ENTRY SIGNAL FXCM Charts are used for Trading Signals based on the ...

800 PIPS ON OFFER FROM GBP USD DECLINE

Image
Having formed a small Pennant just below the major Resistance of a larger Pennant, the GBP USD could be headed towards the Support area some 800 Pips away. If we see a strong bearish signal below the Support of this smaller Pennant, traders can expect a big payday in the weeks ahead. DAILY CHART- LARGE PENNANT Formed following the end of the safe-haven buying of US Dollars during the Financial Crisis; Has now pulled back to the Resistance of the Pennant following a breakout; Could break Support to continue the new Downtrend in favour of the USD to reflect the end of Quantitative Easing; This downtrend has been in place since July this year after forming the high of 1,7190. DAILY CHART - DOWNTREND    If this downtrend is going to continue, we will need to see a convincing bearish breakout signal following the test of the Support of this smaller Pennant. DAILY CHART - PENNANT SETUP ...

STRONG PROFITS STILL CAPTURED BY EURO USD TRADERS

Image
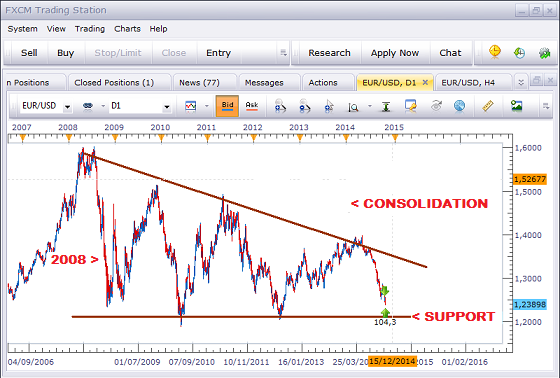
Before the Non-Farm Payroll Numbers for the US on Friday, the EURO USD continued to offer profitable short positions for lucky traders. The downtrend on this pair started at the turn at Resistance of the large Pennant at the 1,4000 area, declining by 1,500 Pips. With the pair now close to the Support of this Consolidation formed in the aftermath of the 2008 flight to safety, we could see another period of volatility ahead of a rally back to Resistance or a significant breakout short.   The chart below shows the Pennant that has defined the movements of the Currency Pair since 2008.  DAILY CHART- LARGE PENNANT SETUP The turn at Resistance took place in May this year, leading to the sharp downtrend that provided strong gains for the US Dollar. DAILY CHART- SHARP DOWNTREND Several opportunities presented themselves during this decline for traders as the Support area came in to focus.  These trades would have t...