EURO USD FINALLY BREAKS SHORT - DANGEROUS 100 PIP TRADE?
After what seemed like an eternity, we have finally got what appears to be a meaningful signal from the EURO USD that could indicate the start of a profitable trend. The pair had been meandering sideways for months above the Resistance of a major Monthly Pennant, forming a smaller Pennant on the Daily Chart in the process. Having formed an even smaller Pennant at the Weekly Range following the break of Support of that Pennant, a strong Bearish Candle Signal has now appeared. Although this might represent the start of further USD gains in the months ahead, a closer look at the price targets indicates the potential for short-term volatility that should be avoided.
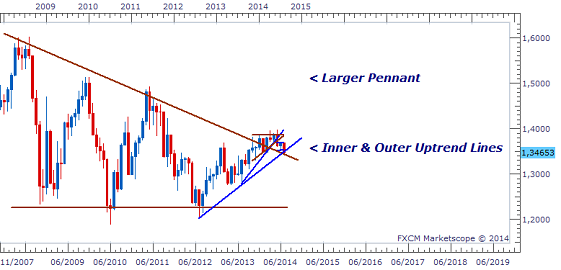
A look at the first chart shows the large Monthly Pennant that this pair has been in since the end of the sharp gains for the USD in 2008. We can also see the current area of price congestion above the Resistance of this Consolidation and the Inner & Outer Uptrend Lines.
DAILY CHART- MONTHLY PENNANT
A closer look at this area above Resistance shows the Pennant on the Daily Chart that was formed and then subsequently broken. There was a brief pause in this breakout at the Weekly Range to from an even smaller Pennant on top of the Outer Uptrend Line and the Monthly Pennant's Resistance.
DAILY CHART- PENNANT FORMATIONS

As with most types of breakouts from Pennants of this size, the trend usually comes to a temporary end at the Weekly Range before continuing. Having completed this 'mandatory' break, the signal to indicate the continuation of the breakout was given today, July 22, 2014. This candle simultaneously broke the Support of the small Pennant, the Resistance of the Monthly Pennant as well as the Outer Uptrend Line.
DAILY CHART- BREAKOUT SIGNAL

This setup and signal given here are very strong and under most circumstances would justify an entry to go short. However, the proximity of the Breakout Equivalent (BE) to the Breakout Candle of only 100 Pips suggests that a short position may not be that feasible.
With all Consolidations, the BE measures the price at which the breakout is expected to end. If this price is going to be hit ahead of the Weekly Range (WR), the breakout usually ends at the BE. If the WR is closer than the BE, then the market would break beyond the WR to hit the BE. The BE is therefore the price target that Consolidation breakouts will go towards regardless of the proximity of other price targets. However, I have found that if the distance between the start of the breakout and the BE is 100 Pips or smaller, the movement can become volatile and may not actually hit any of its targets. Ideally, a distance of at least 130 Pips is needed to ensure that a strong breakout with minimal volatility will take place.
These rules related to breakouts are very important for traders to be aware of when looking to take advantage of these strong setups. Breakouts can offer very fast and profitable trades and they can be all the more appealing when the market has not been offering that many opportunities. However, the knowledge of and the adherence to these small details can make all the difference between a successfully hit target and an unexpected reversal and trading loss.
RECENT EMAIL FROM CLIENT

____________________________________________________
SUBSCRIBE TODAY
____________________________________________________


 |
| US$120.00 |
 |
___________________________________________
Duane Shepherd
(M.Sc. Economics, B.Sc. Management and Economics)
Currency Analyst/Trader
Contact: shepherdduane@gmail.com
Twitter: @WorldWide876
Facebook: DRFXTRADING


Comments
Post a Comment