EURO AUD - ONLY THE STRONG SURVIVE - BULL CROWN TO TAKE OUT WEAK BEAR SIGNAL
A set of bearish candles have broken the Support of the Daily Chart`s Pennant to indicate a potential move lower by 200 Pips. The targets would be the Breakout Equivalent (BE) and the Weekly Range (WR) which are within a few pips of each other. However, the size of the candles given are too small relative to what we expect from Breakout Signals and the ones that normally lead to the start of profitable trends.
FIGURE 1- EURO AUD DAILY CHART
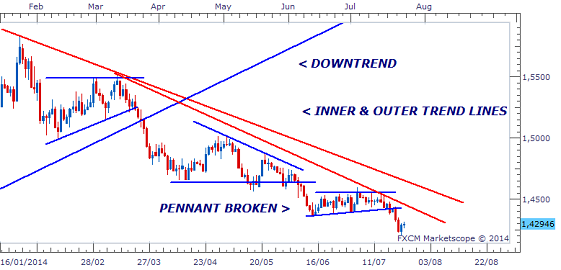
The downtrend is strong with Inner and Outer Downtrend Lines keeping the trend in place, giving it a high chance of continuing lower in favour of the Aussie. But the signals given to continue the trend have been weak, giving it a very low probability of actually hitting the BE and WR targets.
FIGURE 2- EURO AUD DAILY CHART

Breakout signals need to be strong enough to justify entry. If they are too weak, the trend can become volatile, reverse or move sideways. Even if it does begin to trend, there might be spikes along the way that can take out the trade. Signals such as the ones below were stronger and led to smooth breakouts.
FIGURE 3 - USD CAD DAILY CHART

CHF JPY - DAILY CHART

The EURO JPY had also given a similar breakout to this one, but its candle was smaller than required and led to a spike that would have taken out a Stop Loss placed above the candle.
FIGURE 4 -EURO JPY DAILY CHART

So with these weak signals on the EURO AUD, what do we expect to happen next? Well in most cases, if the trend is going to continue, it will pullback temporarily and then U-turn to provide a stronger signal to hit the targets.
FIGURE 5 - EURO AUD DAILY CHART

However, by the time it does this, the number of Pips available would have been significantly reduced. The other more likely thing to happen is that a trend reversal takes place. The currency pair has already moved by 1600 Pips and has hit its Monthly Range on two occasions. We could therefore see a trend change in the form of a Bull Crown, with the Left and Centre Tips already formed with the Right Tip appearing after breaking above the Downtrend Lines.
FIGURE 6 - EURO AUD BULL CROWN?

Weak signals and above-average signals that are too strong have become the norm in recent months. Trends have thus been few and far between as these signals have only led to volatility, Consolidation and False Breakouts. Until normality is restored to the market, Swing Traders will have to be very patient and avoid the temptation of the smaller time frames just for the sake of trading.
RECENT EMAIL FROM CLIENT

____________________________________________________
SUBSCRIBE TODAY
____________________________________________________


 |
| US$120.00 |
 |
___________________________________________
Duane Shepherd
(M.Sc. Economics, B.Sc. Management and Economics)
Currency Analyst/Trader
Contact: shepherdduane@gmail.com
Twitter: @WorldWide876
Facebook: DRFXTRADING


Comments
Post a Comment