Posts

Showing posts from August, 2014

GBP JPY - LOOKING TO CONTINUE NEW DOWNTTREND

Image
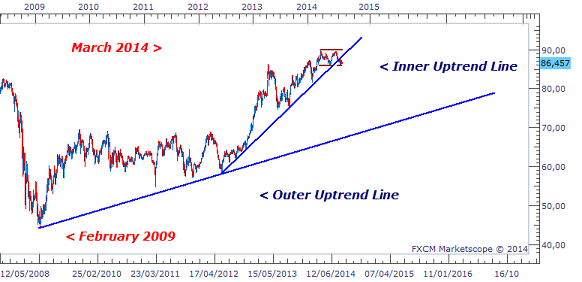
With most of the major Currency Pairs already starting new trends, the GBP JPY also looks to be starting one of its own after breaking its major Inner Uprtrend Line. Having done this, the pair has hit its 500 - Pip Weekly Range and has been moving sideways as is customary at this area. If this movement eventually takes the form of a Range pattern and leads to a bearish breakout, then further gains are expected for the Japanese Yen. We can see the broken Inner Uptrend Line in the chart below that has started a new Downtrend. If this new direction continues, then the Outer Uptrend Lines would be the next major targets. DAILY CHART The sideways movement now taking place could lead to the formation of a Range setup if the 2nd Resistance point is formed (r2). A break of Support with a strong Bearish Candle would then be needed to confirm the continuation of this Downtrend. DAILY CHART     Looking ahead, the next price target to

AUD NZD- BULLISH BREAKOUT SIGNAL ABOVE MAJOR CONSOLIDATION

Image
This pair has given us a Bullish breakout candle to signal the possible start of a sharp breakout in favour of the Aussie Dollar. A Range setup that lies above the Resistance of the larger Pennant was broken today with a strong Bull Candle. Breakouts from large Consolidations often have smaller setups at their boundaries which provide the signal needed to start the breakout. If this breakout materializes, then we could see the first major target at 1,1298 being hit by the end of this month. The chart below shows that this pair began forming the large Pennant after breaking above the major Inner Trend Line of a previous Downtrend. DAILY CHART Large sideways patterns and breaks of Inner Trend Lines often appear at the end of a very long trend and the start of new one. The chart below shows us a closer view of this Pennant that could represent the setup that starts this new trend and takes us up to the Outer Downtrend Line. DAILY CHART You can se

NZD JPY- ABC SIGNAL GIVEN, BUT TO WEAK TO TRADE

Image
We were a bit tempted to enter long on this pair yesterday when it gave us an ABC Bull Signal above the broken Downtrend Line. This could have been the signal needed to take us up to the Resistance of the Range being formed and capture some Pips in the process. However, like many of the signals in the Forex Market these days, this was too weak to justify taking a position. As such, we will either have to wait for a stronger Bullish signal, or look to another pair altogether. The last few weeks have seen the pair gradually moving sideways towards the Inner Uptrend Line. DAILY CHART In doing so, the currency pair has moved in waves of Uptrends and Downtrends to slowly form a large Range pattern. DAILY CANDLE  The Resistance has already been formed with only the 2nd Support price point needed to complete the Consolidation. This was expected to be started with a Bull signal to break the Counter Trend

KIWI DOLLAR- TEMPTING BEARISH SIGNAL FOR HUNDREDS OF PIPS

Image
This pair has been in a very large Pennant setup for the last 3 years since the end of the strong 2-Year Uptrend between 2009 and 2011. We have been hovering on top of the Resistance of this Consolidation for the last few weeks and could see the start of a new Downtrend to carry us back down to Support. A strong Bearish Candle signal has been given in this regard below the current Uptrend Line and this Resistance, but the accompanying setup for the signal is too weak to justify entry. Nevertheless, a stronger setup could materialize this month to either continue the break Bearish, or provide a platform for a strong Bullish reversal. The strong Uptrend that came to an end represented the return of Risk-Appetite to the market following the period of Safe-Haven buying of US Dollars in 2008. This has given way to a very wide Pennant within which we have been experiencing waves of smaller Uptrends and Downtrends. DAILY CHART   Closer to home, so to speak, the pair has fo

NZD JPY- BULLISH SIGNAL NEEDED FOR LARGE GAINS

Image
Consolidation, Consolidation and more Consolidation. When will they end? Only the policy makers at the major Central Banks and the key market players know the answer. Until then, our responsibility as traders of the Larger Time Frames is to accurately spot them, analyze them and trade them for large gains. We do this by using the trading rules established for trading these patterns in my Trading Manual and waiting patiently until our targets are hit. The next major setup that could provide such an opportunity is on the NZD JPY. This has been moving sideways towards the major Inner Uptrend Line following the end of a very long 5 -year rally. DAILY CHART The sideways movement can be seen more clearly on the next chart where a Range setup appears to be taking shape. DAILY CHART This 390-Pip Range would be completed with a rally to the Resistance boundary. A few hundred pips would be ours for the taking if we see a strong Bullish s

EURO JPY- 300-PIP RALLY IN A FEW DAYS

Image
The EURO JPY looks to be about to form the Support boundary of a very large Pennant on the Daily Chart. After ending a very long Uptrend and breaking the Inner Uptrend Line, it has been gradually moving sideways towards the Outer Uptrend Line. We also see what appears to be the start of a Double Bottom formation. If there is a bullish move that breaks the current Downtrend Line, then a rally to the Resistance of this Pennant could take place towards the end of this month. The chart below shows the Inner and Uptrend Lines of the major Uptrend. The end of long trends usually leads to the break of the Inner Trend Line and a gradual drift towards the Outer Trend Line. DAILY CHART From here, the currency could continue to move sideways until it breaks the Outer Uptrend Line to start a Downtrend or rally to continue the main Uptrend. As it moves sideways to reflect the low trading activity across the Forex market, it could rally in the short-term to complete the f