Posts

Showing posts from April, 2014

EURO AUD WEEKLY ANALYSIS

Image
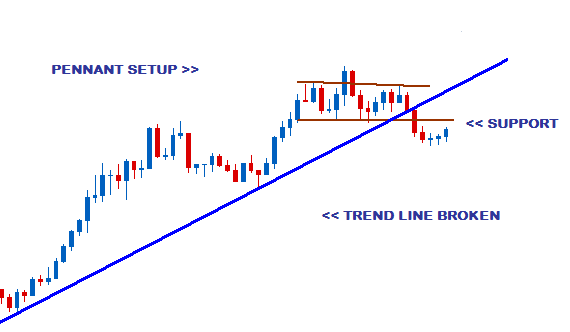
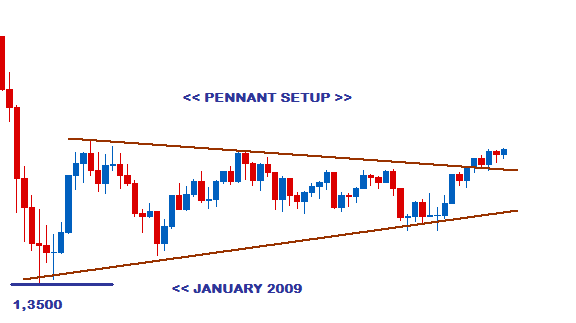
FALSE BREAKOUT OR PAUSE BEFORE SHARP DOWNTREND? False breakouts from consolidation setups are a common occurrence in the Forex market and can take various forms. In the case of the Euro Aud pair, we see that there has been a break of the Support of the Pennant formed just above its uptrend line suggests the start of a sharp downtrend. However, the sideways movement taking place below this area could also be the setup for a rally to go back inside of the Pennant to resume the uptrend. WEEKLY CHART   In many cases, the Support area is tested by a temporary pullback before the breakout resumes from consolidation. This could be the scenario developing here on its way to several hundred pips of gains for the Australian Dollar. On the other hand, the strength of the uptrend suggests that a continued move in favour of the Euro is very likely and that a rally back above Support is expected. Based on the Daily Chart, this could already be

CAD CHF WEEKLY ANALYSIS

Image
CHF LOOKS SET TO CONTINUE GAINS VS CAD There is a very strong possibility that the current downtrend on the CAD CHF will continue over the next few days. The Weekly Chart shows the downtrend still in place, with the currency still below both the Inner and Outer Downtrend Lines. WEEKLY CHART Supporting this expected move is the setup on the Daily Chart. Within the last few weeks, there has been a break of two uptrend lines. If this is followed by a break from the consolidation setup just below one of these uptrend lines, then the start of the downtrend would be confirmed.  DAILY CHART Once this trend begins, the first major target to be hit would be the Support area at 0,7805, 200 Pips away from the current price.  RECENT EMAIL FROM CLIENT ____________________________________________________ SUBSCRIBE TODAY ____________________________________________________ US$120.00 Free    

GBP USD WEEKLY ANALYSIS

Image
STERLING SHOWING INDECISION The sideways movement of the GBP USD in recent months points to a significant amount of indecision about the long-term direction of the pair. The Weekly Chart shows that there is a bit of a struggle to break beyond the Resistance of a large Pennant on the Monthly Chart, while the Daily Chart looks poised to continue the sideways dance for the time being. The chart below shows the large Monthly Pennant setup that was formed after the period of risk-aversion in 2008 during the Financial Crisis that led to sharp gains for the USD. When the sell-off ended at the beginning of 2009, waves of uptrends and downtrends combined to form the current consolidation pattern. MONTHLY CHART The latest uptrend wave in this consolidation has taken us to just above the Resistance, where we see the pair moving sideways, indecisively.  WEEKLY CHART Based on the Weekly Chart´s direction and position above the Resistance area,

USD JPY WEEKLY ANALYSIS

Image
USD JPY HEADING TO PENNANT RESISTANCE Having formed a Pennant on its Daily Chart, the pair looked to have been headed towards the Resistance area of 103,80 after turning at Support. However, there has been a bearish U-turn mid-way the consolidation that could mean one of two things -  a Double Bottom formation at Support, or a break of Support for a sharp breakout short. DAILY CHART DAILY CHART- BULLISH SETUP DAILY CHART - BREAKOUT SHORT The bullish scenario would provide a little over 100 pips in potential gain, while the bearish scenario would give several hundred pips due to the size of the Pennant. As traders, one would hope for the latter option, but for the exporters from Japan, further gains in the Yen would be the last thing they want at this time- the dilemma of market greed versus `real world´ concerns would certainly rage on. RECENT EMAIL FROM CLIENT _____

USD CAD WEEKLY ANALYSIS

Image
POSSIBLE RANGE SETUP FOR  THE LOONIE-GREENBACK Consolidation seems to be the common setup for most of the popular currency pairs recently and the USD CAD does not want to be the odd one out. Daily Chart below shows that the Resistance area has already been formed for the possible Range at 1,1200, with the 2nd Support point needing to be formed to complete the setup.  DAILY CHART A downtrend line has already been broken within this possible Range setup and if the current rally taking place at the 1,0913 area continues to the Resistance boundary, the Range will be complete. Such a move long could also provide over 100 pips in trading opportunity.  Only time will tell what happens, as with setups such as these, Double Bottoms could also be formed before it reaches Resistance.  Cautious trading on this one would be recommended. RECENT EMAIL FROM CLIENT ____________________________________________________

EURO USD WEEKLY ANALYSIS

Image
EURO MEANDERING IN CONSOLIDATION The market´s most popular currency pair has an interesting scenario similar to that of the NZD USD. The Weekly Chart shows that it too has formed a Pennant pattern above the current uptrend line and that it is also sitting on top of the Resistance of the larger Monthly Pennant. That Pennant has its Resistance line connecting just below the highs of 1,6036 of July, 2008 and 1,4939 of May 2011, with Support at 1,2324. MONTHLY CHART WEEKLY CHART As we can see, there was an attempt to break resistance with that recent bull candle, but it came up short of a meaningful breakout. Right now, we could either see another move to break the resistance or another bearish wave back down to the Support of the Pennant. Let´s see what this could look like on the Daily Chart. A bullish breakout with more convincing candles would be needed to go long. If this takes place, its possible that it would be breaking both the Weekl

NZD USD WEEKLY ANALYSIS

Image
NZD USD AT MAJOR CROSSROADS This popular currency pair has started to move sideways, forming a Pennant Consolidation pattern on its Daily Chart. This follows a rally of 740 pips from the low of 0,8050 on February 4th this year. Coinciding with this area is the Resistance of an even larger Pennant on the Weekly Chart. That Resistance connects the high of 0,8841 of July 30, 2011 with 0,8675 of April 30th, 2013. WEEKLY CHART DAILY CHART At this juncture, we could either see a break long above this area to continue the current uptrend or a break short for a new downtrend. Until that break takes place, movement with this 130-Pip consolidation could provide short-term gains for the aggressive trader. RECENT EMAIL FROM CLIENT ____________________________________________________ SUBSCRIBE TODAY ____________________________________________________ US$120.00 Free     ___________________________