EASY 100-PIP STRATEGY - SO WHY DID IT FAIL?
As part of my Day Trading arsenal a few months ago, I used to go after 100 Pip movements using the 30 Minute Charts, exiting within 24 to 36 Hours. The Daily and 4 Hour Charts were used to provide the major setup while the patterns and breakout signals on the 30 Minute Charts were used for Stop Losses, Entry and Targets.
This worked for awhile with moderate results, but the weight of the negative habits and difficulties of smaller time frame trading eventually took their toll on this strategy, shortening its lifespan. This was one of several failed strategies that eventually led to the more profitable strategy on the higher time frames that I now trade and promote. Take a look at this 100-Pip strategy and let me know if you could have continued with it or improved on it in anyway.
This worked for awhile with moderate results, but the weight of the negative habits and difficulties of smaller time frame trading eventually took their toll on this strategy, shortening its lifespan. This was one of several failed strategies that eventually led to the more profitable strategy on the higher time frames that I now trade and promote. Take a look at this 100-Pip strategy and let me know if you could have continued with it or improved on it in anyway.
These were the main aspects of the strategy.
- Wait on the Daily Chart to give Signal/Direction;
- Wait on the 4 Hour Chart to provide a Setup;
- Enter at the 30 Minute Signal that breaks the 4H Setup Barrier;
- Only Enter at Signals given between 5 00 GMT and 17 00 GMT;
- Set target for 100 Pips;
- Hold Trade no later than 21 00 GMT the next day;
The Daily Chart provided the main direction for the trend. I would wait until the appropriate signal was given to start a new trend or to continue the existing trend. Whenever this signal was given, the 4H Chart usually provided a Counter Trend Line or a Consolidation setup. I would then look at the 30 Minute Chart to see the start of the breakout from this 4 Hour setup and enter accordingly. This signal had to be provided between that time period, as those were the signals that had a high chance of being the correct ones that led to the breakout. That timeframe is also useful for Day Traders who enter and exit on the same day. If they entered within that period, the best time to exit would be at 17 00 GMT as the Daily Range for most currencies ended at that time.
Here was a typical trade setup.
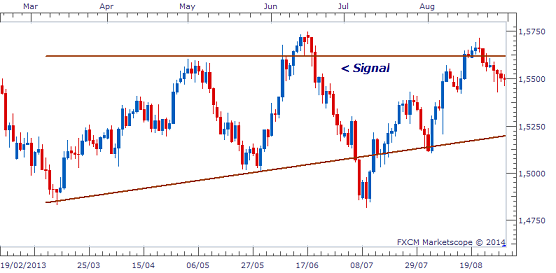
DAILY CHART - GBP USD
Shortly after that signal was given, the 4 Hour Chart gave this Counter Trend Line (CTL) setup.
GBP USD -4 HOUR CHART

To then trade the expected breakout, I would go to down to the 30 Minute Chart to determine the boundary to be broken and the Stop Loss area. In this case, the setup was an Uptrend Line with a Small Range.
30 MINUTE CHART

The signal came within the designated time period on Friday June 21, 2014 with the Stop Loss Placed below the Trend Line. The 100-Pip target would be set and then hit on Monday June 24 at 10 30 GMT, effectively within the Holding Period limit, ignoring Saturday and Sunday.
30 MINUTE CHART

This was the basic principle behind these trades. The Daily Chart had to give the signal and the 30 Minute and 4 Hour setups needed to be strong and clear. You entered the trade, left it and then only checked it when the Holding Period was up or the trade was Stopped Out/Target hit.
However, one of the problems with the strategy was that the Stop Losses were often large. A good setup provided a Stop Loss of no more than 40-50 Pips to give a Risk-Reward of 2.0 to 2.5. But sometimes the Stop Losses were more, cutting the Risk-Reward and the overall profitability if there were losses along the way. At times, the setups would also change from being a Pennant to Range or a False Breakout would take place to take out the trade.
Also, since one was focused on the quick 100 Pip move, one often overlooked important details on the larger charts that indicated that the breakout would not go to the target. The Daily Chart may have given a good signal, but this may have been the last signal before it hit a major price point that would lead to a trend change. One also became more anxious after a trade loss because of the limited time in between trade opportunities to recover. This gave me `Beer Goggles` that made otherwise risky, unattractive setups look tradeable due to the desire to recoup losses as quickly as possible.
Also, since one was focused on the quick 100 Pip move, one often overlooked important details on the larger charts that indicated that the breakout would not go to the target. The Daily Chart may have given a good signal, but this may have been the last signal before it hit a major price point that would lead to a trend change. One also became more anxious after a trade loss because of the limited time in between trade opportunities to recover. This gave me `Beer Goggles` that made otherwise risky, unattractive setups look tradeable due to the desire to recoup losses as quickly as possible.
These were some of the basic drawbacks to the strategy that made it unsustainable. Combined with the long 12 hour wait for the perfect signal in the early hours following only 4 or 5 hours of sleep and the volalitly of smaller time frames generally, this could not continue. The Daily and 4 Hour charts on the other hand gave fewer False Signals with more reliable setups. This allowed me to take the time to carefully assess the market and generate regular, profitable trades with less stress and volatility.
RECENT EMAIL FROM CLIENT

____________________________________________________
SUBSCRIBE TODAY
____________________________________________________


 |
| US$120.00 |
 |
___________________________________________
Duane Shepherd
(M.Sc. Economics, B.Sc. Management and Economics)
Currency Analyst/Trader
Contact: shepherdduane@gmail.com
Twitter: @WorldWide876
Facebook: DRFXTRADING


Comments
Post a Comment