SUBSCRIBERS NOW UP 53% WITH 200-PIP AUD NZD TRADE
This latest 200-Pip gain involved a Consolidation
Breakout trade from a Range setup on the Daily Chart of this Aussie pair. The Support boundary was
initial broken with a weak Bearish Candle but was soon followed by a stronger U-Turn
Signal that indicated the resumption of the breakout. Having determined that
the overall setups on the Daily and 4 Hour Charts were in sync with the
Methodology’s criteria, the trade was executed on Sunday March 29, 2015. After only a few days, the target was subsequently hit
within the established holding period to push the overall return for
Subscribers to 53% from only 12 trades, generating 868 Pips along the way.
Apart from the strong trading profit that
Subscribers would have enjoyed on their Retail and Institutional Trading
Accounts, the sharp Bullish Reversal in the market a day later would have
provided them with additional reassurance about the accuracy of the
Methodology. With Consolidation Breakouts, there is a greater tendency to hold
out for a greater number of Pips than the market is offering given the larger
Pip ranges of these breakouts. However, once the rules of the strategy are
always followed, a consistent rate of growth will continue to be accrued on
your portfolio in the months and years to come, with few market surprises.
GENERAL
MARKET PATTERN
The over direction of the pair has been
predominantly bearish since March of 2011. There have been brief periods of
Consolidation that may have led to a reversal but the bears eventually take
control and have provided significant gains for the Kiwi against its major trading
partner’s currency. As with all trends that have lasted for several years,
Long-Term, Outer and Inner Trend Lines tend to be formed.
DAILY
CHART - STRONG DOWNTREND & CONSOLIDATION BREAKOUT
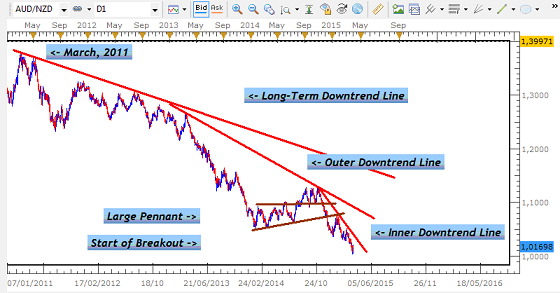
Given the strength of this downtrend and the
start of the breakout from the Large Pennant, it was no surprise that the most
recent Consolidation setup would be broken short. This would come in the form
of an Evening Star Candlestick Formation as the market rallied and U-Turned
after testing the Support boundary of the Range.
DAILY CHART - RANGE SETUP
TO RESUME BREAKOUT

After determining that the setup of this
trade conformed to the parameters set out in the Trade Sheet for Consolidation
Breakouts...
TRADE SHEET CHECK LIST 
... a Trade Setup was circulated to
Subscribers with details on the Entry, Stop Loss and Limit Orders using the 4
Hour Chart...
4 HOUR
CHART - ENTRY & STOP LOSS SETUPS

4 HOUR
CHART - TRADE TARGET SETUP

After 6 patient days, the target was
eventually hit on Sunday April 5th.
DAILY
CHART - TARGET FINALLY HIT

This
trade pushed the Return for Subscribers
to 53% and 40% on the Demo Account that tracks the trades sent to Subscribers
(behind by 3 trades).
RATE OF
RETURN FOR SUBSCRIBERS
 |
| (Assumes a starting capital of US$ 5000 for a Subscriber; Only 4 Trades Remain for a 100% Return; 105 Pips and 150 Pips Avg. Stops and Limits as per Methodology) |
RATE OF
RETURN ON FXCM ACCOUNT

FXCM
INDIVIDUAL TRADE RESULTS
 |
| (http://www.myfxbook.com/members/DRFXTRADING/duane/1079693) |
Relative to the recent performance of the top 10 Currency Traders,
...and the 2nd Best Trader between 2008 and 2013 ranked by BarclayHedge Currency Index...
...these Subscribers continue to surpass them with room to spare.
CURRENCY TRADERS MANAGING MORE THAN US$10 MILLION
AS OF FEBRUARY 2015
 |
| Names of CTAs withheld to comply with Redistribution Terms of BarclayHedge |
RATES OF RETURN OF JARRATT DAVIS
 |
| http://www.jarrattdavis.com/ |
...these Subscribers continue to surpass them with room to spare.
Most of these profitable trades have been
the result of accurate trade targets being set according to the setup
presented. These exit points generally coincide with major price point areas
that lead to strong pullbacks in the market over subsequent days. This recent
trade was another example of the reversals that take place at these areas and
the need to adhere to the guidelines for exit, regardless of the number of
Pips.
Within a few days, the market rallied
sharply to close Tuesday’s US trading session with a strong Bullish Candlestick
Formation (reaction to the Interest Rate decision and Statement by the Reserve
Bank of Australia
DAILY
CHART - SHARP TREND REVERSAL SIGNAL

30 MINUTE
CHART

The reversal seen on the Daily Chart is one
of the signals given by the market to indicate the end of the Consolidation
Breakout.

There is nothing more frustrating than
coming back to the charts to see a perfectly good trade taken out by these
reversals, especially if it begins a few Pips ahead of our intended trade
target. This is why the following exit points were identified and discovered to
be the best way to maximize on these trades while staying away from these
“surprises”;
- Resistance/Support
Boundaries;
- The Breakout
Equivalent;
- The 200-Pip
Maximum (where possible);
- The
- The
The choice of targets ultimately depends on
whether we are trading a Trending or Consolidating market and the size of the
Consolidation Pattern in question. So long as these are chosen appropriately on
each occasion, these market surprises will be the exception with large Pip
gains such as these becoming the RULE in your trading.
___________________________________________________


Hello Everybody,
ReplyDeleteI've attached a list of the most recommended FOREX brokers:
1. Most Recommended Forex Broker
2. eToro - $50 minimum deposit.
Here is a list of the best forex instruments:
1. ForexTrendy - Recommended Odds Software.
2. EA Builder - Custom Strategies Autotrading.
3. Fast FX Profit - Secret Forex Strategy.
Hopefully these lists are helpful to you.