STRONG PROFITS STILL CAPTURED BY EURO USD TRADERS
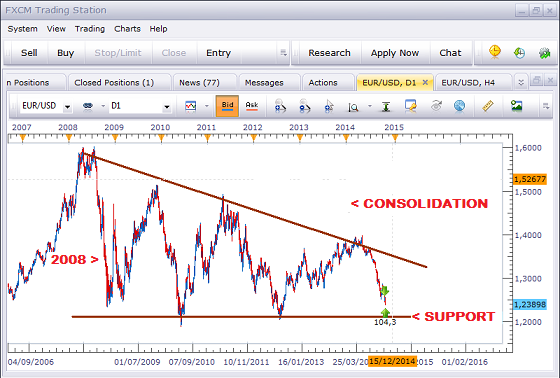
Before the Non-Farm Payroll Numbers for the US on Friday, the EURO USD continued to offer profitable short positions for lucky traders. The downtrend on this pair started at the turn at Resistance of the large Pennant at the 1,4000 area, declining by 1,500 Pips. With the pair now close to the Support of this Consolidation formed in the aftermath of the 2008 flight to safety, we could see another period of volatility ahead of a rally back to Resistance or a significant breakout short.
The chart below shows the Pennant that has defined the movements of the Currency Pair since 2008.
DAILY CHART- LARGE PENNANT SETUP
The turn at Resistance took place in May this year, leading to the sharp downtrend that provided strong gains for the US Dollar.
DAILY CHART- SHARP DOWNTREND

Several opportunities presented themselves during this decline for traders as the Support area came in to focus. These trades would have taken place with breaks of Consolidation patterns and Counter Trend Lines on both the Daily and 4 Hour Charts. The most recent one came a few days before the NFP data on Friday and allowed traders to exit ahead of the potentially volatile reaction.
DAILY CHART- COUNTER TREND LINE BREAK

4 HOUR CHART - PENNANT & COUNTER TREND LINE BREAKS

Evening Stars are also a popular bearish signal that can be traded with confidence. Stop Losses are placed above the high of these U-turns. (CURRENCY TRADING WITH THE DAILY & 4 HOUR CHARTS - Section 3 - Currency Patterns & Market Direction)
In September, breaks of a Pennant, Counter Trend Lines on the 4 Hour Chart also provided a significant payout for the sharp trader following the continuation of the trend with a break of a Counter Trend Line on the Daily Chart.
DAILY CHART- CTL BREAKOUT

4 HOUR CHART- ENTRY SETUPS

Taking advantage of these trends requires spotting the strongest setups and signals that allow traders to remain in the trade without the need to move their Stop Losses nor monitor their positions. One must also be aware of the targets at which to exit trades so that there aren't any unexpected reversals that erode our profits. At the stage of the trend, the proximity of the pair to the Support Level suggests that we are likely to see an upcoming period of sideways movement.
Generally after such larger trends that take us to the boundary of a major Consolidation, the market will pause as it decides on its next move. We could either see a rally that takes us all the way back up to Resistance or a break of Support. Such a break would be significant as it would represent the end of the long period of market indecision on this pair following the safe-haven buying of US Dollars during the 2008 Financial Crisis.
Which ever direction materializes, let´s stay prepared with the right strategy for more opportunities that will surely be offered.
___________________________________________________________
RECENT EMAIL FROM CLIENT

____________________________
GET STARTED TODAY
____________________________
GET STARTED TODAY
____________________________

 |
| US$99.00 |
 |
| US$99.00 |

|
| US$69.99 |

|
| US$49.99 |

 |
FREE
 |
 |
| FREE |
_____________________________
Duane Shepherd
(M.Sc. Economics, B.Sc. Management and Economics)
Currency Analyst/Trader
Contact: shepherdduane@gmail.com
Twitter: @WorldWide876
Facebook: DRFXTRADING


Comments
Post a Comment