3-Wave Rule Denies Traders Sharp Gains on GBP CAD
After starting what appeared to be a strong Bearish breakout from its Consolidation setup this week, this pair has now started to pull back sharply Bullish, much to the chagrin of Currency Traders. As surprising as this may have been to some, there was a key Technical Factor at work that was always going to have a hand in this reversal that my traders were aware of - the 3-Wave Rule of trends in the Currency Market.
There are generally two types of trends that are seen in this market. They will either be sharp and fast with very few pullbacks or slow and steady with waves of U-Turns along the way. Whenever they take the form of waves as was the case in this Range breakout, they will usually pullback and reverse after 3 of these waves are completed. Following this, the pair will either take a break before resuming the trend or start a new trend in the opposite direction (Section 9 - “Consolidation Trading on the Forex Market - A Complete System for Illiquid Market Conditions”).
As we see in the chart below, this is exactly what has taken place following the start of the downtrend at Resistance.
DAILY CHART - GBP CAD
The size of the Range, the three strong waves of bearish signals and the breakout at Support, should have meant the start of large Pip gains for short traders in the days that followed. However, as with the other Technical Factors that lead to False Breakouts in this market (Section 6), the 3-Wave Rule would not be denied. After a few days, the currency pair started to pullback with Bullish Candles to deny me and my clients valuable additions to our growing trade results.
DAILY CHART- GBP CAD
Spotting these pullback areas is key to choosing the currencies that can be traded successfully and side-stepping those that will lead to losses. From this point, we could have two alternate scenarios playing out in the days ahead. In the first, this pullback could only be temporary, giving way to a strong U-Turn after testing the Support of the Range.
DAILY CHART- TEST OF SUPPORT
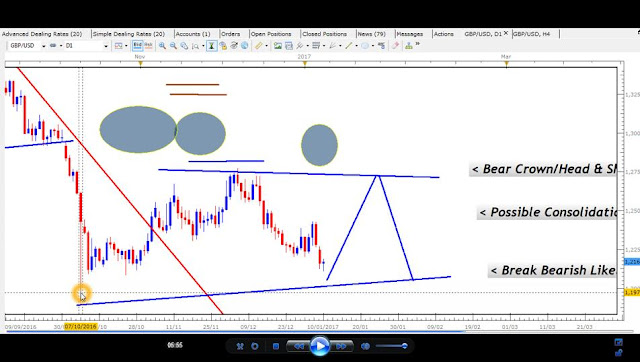
In the second scenario, this pullback could actually be the start of a Bullish reversal, supported by what would be the formation of Double Bottoms below this Range.
DAILY CHART- DOUBLE BOTTOMS & BULLISH REVERSAL
We would then see the pair rally sharply back inside the Range to the Resistance boundary, over 300 Pips away.
Setups and scenarios like these can be seen across the currency market on all pairs and on all time frames with Japanese Candlesticks. False Breakouts are a common occurrence and the 3-Wave Rule is one of the main reasons that they take place to surprise the unprepared trader. Once these and other important factors are incorporated into a comprehensive trading plan, more gains than losses will be realized, providing you with profitable trading results each month.
___________________________________________________________
RECENT EMAIL FROM CLIENT


Hey Ya'll,
ReplyDeleteBelow is a list of the most recommended forex brokers:
1. Best Forex Broker
2. eToro - $50 min. deposit.
Here is a list of money making forex instruments:
1. ForexTrendy - Recommended Odds Software.
2. EA Builder - Custom Strategies Autotrading.
3. Fast FX Profit - Secret Forex Strategy.
I hope you find these lists helpful.