TRADING GAIN OF 76 PIPS AND 3.68% AS CAD JPY RALLIES AS PREDICTED
This trade provided a gain of 76 Pips for me and my DRFX Subscribers and a 3.68% Rate of Return on my Live Account, as we took advantage of the formation of the Range Consolidation Setup on the Daily Chart of the CAD JPY. It also represented the latest in a series of accurate Trade Signals identified by my Methodology over the last few weeks, that you can also receive when you become a Subscriber to my Service through my website DRFX SWING TRADING MENTORING.


(M.Sc. Economics, B.Sc. Management and Economics)


This pair provided a strong Bullish Signal on its Daily Chart earlier this week to indicate the start of a strong rallly in favour of the Canadian Dollar. This was in sync with my prediction a few days before where I saw that based on the pattern of Bullish and Bearish trends already formed, the pair was likely to be forming the Range Setup and that a rally was expected.

...and as you can see, the Bullish Signal to start this rally was provided as predicted...

Supporting this expected rally was the Bull Crown/Inverted Head and Shoulders Pattern on the 4 Hour Chart. This is a common pattern that indicates the end of a previous trend and the start of a new one, which increased the likelihood of a Bullish Move.

Given the likelihod of this rally, the 4 Hour Chart was then used to provide us with an entry opportunity.
The first thing that was done was to identify a suitable and strong Stop Loss area. There were two options. The first was to place it below the Support of the Bullish Engulfing Signal. The other option was to be more aggressive by placing it higher, using the Uptrend Lines formed to protect the trade...


This second Stop Loss Area was the one that I used because I did not expect the market to pull back by much to threaten this area. So with this higher Stop Loss and the trading target set just below Resistance, my entry took place with the following setup..

After the market pulled back temporarily as expected, it then resumed the uptrend and eventually made its way to the Resistance Area. Exit took place at the end of the 2-Day Holding Period for a gain of 76 Pips, just a few Pips short of the original target of 81 Pips (for trading targets of more than 70 Pips, the Holding Period is extended to 48 Hours).


You can also see this result on my Live Account.

4 HOUR CHART TRADING GAIN


My trades are done both on the FXCM platform that I use to identify Market Direction based on the New York Close of the Daily Candle as well as on my Live Account with FXPRO.
The charts provided by FXCM are a lot clearer and are better for my analysis but with FXPRO, I can see the exact Percentage Values of my Risk and Reward for each trade and receive email alerts when the trades are closed so I do not need to watch my trades. This helps to avoid the self-sabotaging habit of closing trades too early!
CAD JPY TRADE SUMMARY

USD JPY TRADE SIGNAL

EURO AUD TRADE SIGNAL

GBP AUD TRADE SIGNAL


GBP AUD TRADE SIGNAL


AUD USD TRADE SIGNAL


EURO AUD PREDICTED SIGNAL


EURO AUD TRADE SIGNAL


Your Mentor
Duane Shepherd


Currency Analyst/Trader
shepherdduane@gmail.com /(876)-393 3355
Twitter: @WorldWide876
________________________________
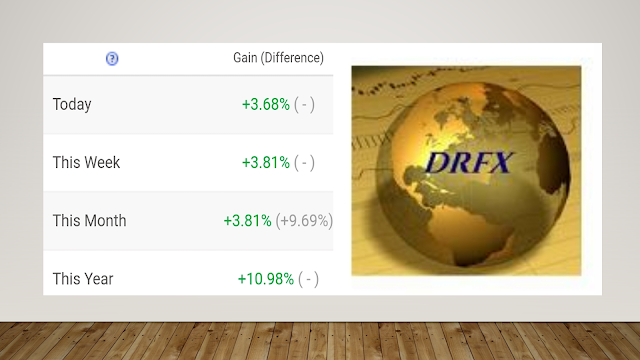
This latest trade on the CAD JPY has pushed the Rate of Return back up to 10.98% since the new Methodology began to be used in February this year.
RATE OF RETURN FEBRUARY 1ST TO SEPTEMBER 13, 2018


Despite being down from the 16.0% Return as at June due to a few losing trades...
RATE OF RETURN AS AT JUNE 30, 2018
 |
| When you view the system at myfxbook.com, use the Custom Analytics tool to specify the dates. The performance of the account before February 1st represented the creation of the Methodology and hence do not represent its true performance. |
..only a few trades are needed to hit the first trading target of 14% once again, before reaching the 30% mark in a few weeks...
ANNUAL RATE OF RETURN TARGETS

This CAD JPY trade was also another example of the new aggressive methodology of capturing 50 to 70 Pips - sometimes more - within 24 Hours, by targeting the major moves of the Daily and 4 Hour Charts each week.
TRADING METHODOLOGY

SUMMARY OF THE METHODOLOGY
 |
This trade was an example of one of the market setups that we trade based on Japanese Candlestick Signals on these time frames. It involves trading the early Bullish and Bearish waves that lead to the formation of Consolidation Setups.
MARKET SETUP TRADED


So instead of waiting until the Consolidation is completed to then trade between Resistance & Support, we can also trade these trends to capture early trading gains, as long as the signals provided by the Daily and 4 Hour Charts are strong and clear.
DETAILED VIDEO ANALYSIS OF TRADE
___________________________________________
DETAILS OF THE CAD JPY TRADE RESULT
DAILY CHART CONSOLIDATION PREDICTION SEPTEMBER 7, 2018

...and as you can see, the Bullish Signal to start this rally was provided as predicted...
DAILY CHART BULLISH SIGNAL SEPTEMBER 11, 2018

Supporting this expected rally was the Bull Crown/Inverted Head and Shoulders Pattern on the 4 Hour Chart. This is a common pattern that indicates the end of a previous trend and the start of a new one, which increased the likelihood of a Bullish Move.
4 HOUR CHART BULL CROWN SETUP

Given the likelihod of this rally, the 4 Hour Chart was then used to provide us with an entry opportunity.
The first thing that was done was to identify a suitable and strong Stop Loss area. There were two options. The first was to place it below the Support of the Bullish Engulfing Signal. The other option was to be more aggressive by placing it higher, using the Uptrend Lines formed to protect the trade...
4 HOUR CHART STOP LOSS PLACEMENT


This second Stop Loss Area was the one that I used because I did not expect the market to pull back by much to threaten this area. So with this higher Stop Loss and the trading target set just below Resistance, my entry took place with the following setup..
4 HOUR CHART ENTRY SETUP

After the market pulled back temporarily as expected, it then resumed the uptrend and eventually made its way to the Resistance Area. Exit took place at the end of the 2-Day Holding Period for a gain of 76 Pips, just a few Pips short of the original target of 81 Pips (for trading targets of more than 70 Pips, the Holding Period is extended to 48 Hours).
4 HOUR CHART TRADING GAIN

DAILY CHART RALLY AS EXPECTED

You can also see this result on my Live Account.
FXPRO LIVE ACCOUNT DAILY CHART

4 HOUR CHART TRADING GAIN

THE TRADE SUMMARY

My trades are done both on the FXCM platform that I use to identify Market Direction based on the New York Close of the Daily Candle as well as on my Live Account with FXPRO.
The charts provided by FXCM are a lot clearer and are better for my analysis but with FXPRO, I can see the exact Percentage Values of my Risk and Reward for each trade and receive email alerts when the trades are closed so I do not need to watch my trades. This helps to avoid the self-sabotaging habit of closing trades too early!
TRADING PLATFORMS USED


KEY HIGHLIGHTS OF THIS TRADE
____________________________________
Bullish & Bearish Patterns Predicted the Formation of the Range Setup on the Daily Chart.
The Bullish Engulfing Signal on the Daily Chart indicated the start of the Rally.
The Bull Crown Setup on the 4 Hour Chart provided support for the Expected Uptrend.
Support Points and Trend Lines can be used for Stop Loss Placement.
Once you Accurately Forecast Market Setups and Signals, Strong Trading Gains can be Yours!
___________________________________
Your Mentor
Duane Shepherd
Currency Analyst/Trader
shepherdduane@gmail.com /(876)-393 3355
Twitter: @WorldWide876
________________________________
There are many well-intentioned Forex Courses and Mentors globally. However, most fall short of the mark in terms of what you really need to take advantage of the Forex because of the limited Testing and Research that went into creating their Systems.
This is why they only work in the Short-Term.
To correct this, you need to have a totally new approach from the ground level with theories that have been extensively tested for 10 years, during both Normal and Abnormal market conditions.
This is what you will finally get as a DRFX Subscriber.
________________________________


________________________________

________________________________


very nice blog.I actually enjoyed reading through this posting.Thanks for sharing Forex Signals Providers in UK | Forex Buying & Selling Online
ReplyDelete