PROJECTED PENNANT FORMED ON EURO USD DAILY CHART - STRONG BREAKOUT AHEAD?
This pair has
now formed the predicted Pennant Setup on the Daily Chart and has now resumed
the bearish breakout from the larger Pennant Consolidation. There had been an
initial Counter Trend Line (CTL) Setup that was broken in an attempt to resume
this downtrend, but because of the weak nature of the candles and the
subsequent Bullish Candle, a Pennant was forecast to be formed. This tends to
happen when CTL breaks are weak and knowledge of this dynamic of the market can
be used to avoid pullbacks that can take out trades.
GENERAL MARKET
PATTERN
As can be seen
in the chart below, a break out has started from the large Pennant formed in
the aftermath of the Financial Crisis and safe-have flows of 2008.
DAILY CHART -
PENNANT CONSOLIDATION
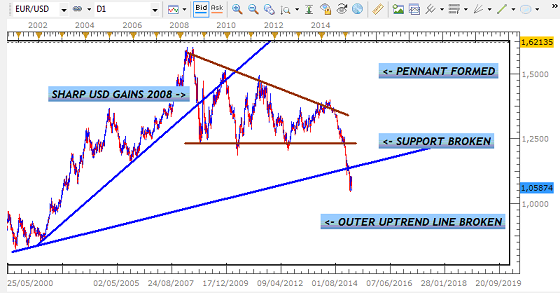
Given the size
of this Consolidation and the general theory behind Consolidation Breakouts,
the gains for the USD are likely to continue for the rest of the year as we
head towards the next major Support of 0.8230.
DAILY CHART - FORECAST
BREAKOUT TARGET

The chart below
shows the break of a CTL setup that appeared set to lead to another bearish
move as part of this major breakout.
DAILY CHART - COUNTER
TREND LINE BREAKOUT

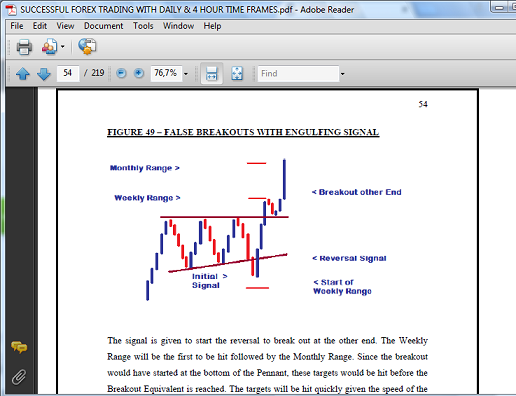
The initial
breakout candle was bearish but was too weak to justify entry. This was
followed by an opposing Bullish Candle that took out that Bearish Candle.
Reversals like this tend to take place when initial breakout signals from
Counter Trend Lines and Consolidations are too weak. These weak signals are
normally followed by reversals that take them out which can lead to;
1. A Stronger Signal
2. The Formation
of another setup
3. A Trend Reversal
Given the
strength of the overall downtrend, the formation of another setup in the shape
of a Pennant was predicted - the norm with weak breaks of Counter Trend Lines.
DAILY CHART - PROJECTED
PENNANT & BREAKOUT

After pulling
back higher and then U-Turning bearish, the formation of the Pennant was
completed a few days ago. This was then followed by a break of the Support that
could now lead to the resumption of the downtrend.
DAILY CHART - PENNANT
FORMED

MARKET FORECAST
Having formed
this Pennant and now broken the Support, there are two possibilities that lie
ahead. Given the weak nature of the breakout candles, we could have yet another
reversal that leads to another, stronger Consolidation Setup.
DAILY CHART -
LARGER PENNANT TO BE FORMED?

On the other
hand, this downtrend has been characterized by weak candles which have still
led to profitable moves since it began in May of 2014. As such, it is very
possible that the current small candles lead to another round of 400 Pip gains
for the USD towards the end of April (the average Weekly Range
DAILY CHART - BREAKOUT
PROJECTION

SWING TRADERS GUIDE
Although a
profitable move may come with these weak candles, the guidelines for the Swing
Trading Methodology remain the same - only trade strong breakout Setups with
Normal Candles. Since there will always be other Currency Pairs and stronger
setups from which to choose, there will never be a need to change one’s
strategy. This market will always
provide opportunities that are in sync with the Methodology and these always
“compensate” for the sacrifice of letting some trades pass us by.


Comments
Post a Comment