70% OF TOP TRADERS BEATEN BY DRFX TRADING
Since its inception in July of this year, the Trading
Service offered to clients has provided them with five trade setups. These included two losses on a long position on the AUD USD
and a
short position on the CHF JPY. However, gains from a long position on
the AUD
NZD and short positions on the AUD USD and the CHF JPY were more than
able to compensate for these losses. Overall, these results were
equivalent to a rate of return of 8.0% between July 1 and October 10,
2014. This was higher than the Year-To-Date returns of 70% of the Top
Currency
Traders in the latest BarclayHedge Rankings as at September 30, 2014.
RATE OF RETURN (5% RISK PER TRADE)

BARCLAYHEDGE RANKINGS AS AT SEPTEMBER 30, 2014

Centurion Fx Ltd. (6X) - (3.35%)
This company uses a combination of Swing Trading (1-2 days) and Intraday Trading (1-5 hours) strategies as part of their systematic trading model. They also use Trailing Stops in targeting a 2 to 1 Reward to Risk Ratio with a small risk exposure per trade. While the use of Trailing Stops is a very popular way of locking in profits ahead of reversals, this can be a double-edged sword that limits profitability.
Markets have a natural tendency to wave and pullback as they make their way towards major price points. If, through manual interference or computer programmes/algorithms, Trailing Stops are implemented, trades can be prematurely closed at these temporary pullbacks before they have a chance to reach larger profit targets. It is for this reason that I have identified the areas that provide the strongest protection from these waves early in the trend, so that the maximum benefit from a profitable trend is obtained. In doing so, I also target trends that last beyond 2 days to capture an even larger share of Pips that are offered by the market on a weekly basis -the Weekly Range.
LCJ Investments SA (LCJ FX Fund Strategy) - (11.72%)
This company uses a fundamental and discretionary global macro strategy expressing both directional and non-directional views on currencies using FX options. The investment universe includes major currency pairs, non-traditional crosses, and emerging market currencies. The Strategy has two distinct areas of investment: 1) Medium Term Allocation - invests in directional trades on currencies on a 2/3 month basis 2) Long Term Allocation - invests in directional and non-directional trades on currencies on a 6/12 month basis. These two areas of allocation seek to offer broad diversification in terms of time horizon, product, and investment objective: allocating across different time horizons, allocating to a range of currency pairs including majors, relative value crosses and emerging, and through using a combination of vanilla and barrier FX OTC option and spot products, which we believe have characteristics that assist the portfolio by not being constrained to the linear (spot) universe. Full portfolio transparency is available to each client.
In contrast to this approach, my Methodology targets the Short-Term period of a few days to a week. While this may be more volatile relative to a 3 to 12 month time frame, it reduces the level of investor uncertainty that is more of a factor within this extraordinary policy environment. The low interest rate policy by the major central banks has also reduced the influence of interest rate differentials on currency demand, making long, stable trends a very rare occurrence. This has led to the formation of Consolidation patterns that have become more prevalent in the absence of meaningful trends. As such, a strategy that is able to incorporate these patterns into its tool box is of greater value to clients seeking profitability in all market conditions.
P/E Investments (Standard - 18.47%, Aggressive - 28.44%, Conservative - 8.89%)
These three strategies used by this company involve a systematic dynamic process utilizing a Bayesian statistical approach. The program invests in all major currencies by constructing an optimized portfolio that maximizes return for a given volatility level. Specifically, the FX program utilizes several fundamental factors to forecast returns for each currency on a weekly basis. These forecast returns are combined with the current volatilities and correlations to determine positions in each market that will yield a targeted risk level and maximum return. The process is systematic and therefore reliable and the process is dynamic. Each variable is re-weighted depending on its effectiveness. As variables become more effective they increase in weighting and as they become less useful, their weighting is automatically reduced. In summary, the FX program is disciplined dynamic systematic fundamental process that is risk managed to a risk level designated by the client.
As an Economist, I can appreciate the use of economic factors in the analysis and forecast of currencies. Surprisingly, however, such a comprehensive approach is totally unnecessary in being able to accurately predict market movements. All Currency Pairs have a cycle of technical patterns which, once identified and understood, provide all the information needed to make trade decisions. Weekly economic data is also often volatile and uncorrelated to actual currency direction and can therefore be misleading. Candlestick Formations, Trend Lines, Consolidations and the average Weekly Range of each Currency Pair are all the tools required to predict 90% of the market’s most profitable movements.
THE METHODOLOGY
The trades that are shown here were developed from a Price Action-based strategy that uses the most accurate Candlestick Patterns and Signals of the Daily and 4 Hour Charts. These time frames provide more stable and reliable trading patterns and are thus more amenable to consistent profitability. Specific combinations of Chart Patterns and Signals on these charts have been found to continuously provide the most profitable trading opportunities across all Currency Pairs in the Forex Market. Once these signals are identified and traded within the context of established Rules and Parameters, larger rates of returns are more likely for both Retail Traders and Currency Fund Managers.
The Methodology involves exploiting the Trending and Range bound patterns of a Currency Pair over the Short-Term (4-7 Days). It does so by utilizing the Signals and Setups on the Daily and 4 Hour Charts to identify the most profitable breakouts that provide a large number of Pips per trade. The New York Close of the Daily Chart is used for to obtain these Signals from FXCM while the trades are executed on my Live Account at Dukascopy. The main aspects of the Methodology are;
- Identification of Market Direction using Candlestick Patterns;
- Using the Daily & 4 Hour Charts for Entry Signals & Stop Placement;
- Aiming for 100 to 200 Pips per trade;
- Trading to the Weekly and Monthly Ranges of each Currency Pair;
- Risking 5% per trade (90-120 Pips);
- Holding Trades for a Pre-Determined Number of Days to eliminate the uncertainty of when to exit Profitable Trades - the Achilles Heel of traders.
The risk per trade is not fixed. Each client is able use a risk level that is in keeping with their risk tolerance and their required rate of return. The Methodology does not utilize Statistical Indicators nor is it dependent on the subjective analysis of short-term Economic Data. Although many successful traders include indicators in their analysis of the market, most of these indicators are lagging in nature given their use of past price data. Short-term Economic Data released on a daily basis can be quiet volatile and are often uncorrelated to the most profitable currency movements.
TRADE RESULTS
CHF JPY OCTOBER 6- OCTOBER 10, 2014
Trade Type
|
False Consolidation Breakout
|
Signal Given
|
Daily Chart Bearish Candle
|
Target
|
Near End Value
|
Result
|
76 Pips
|
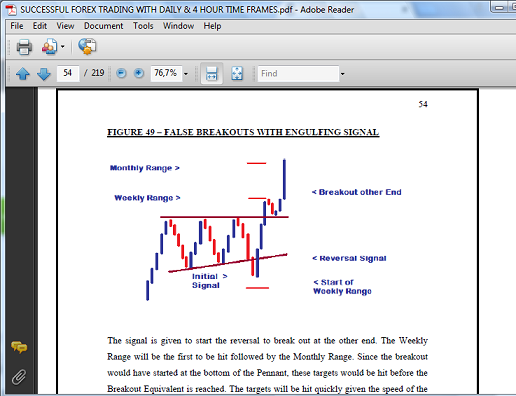
This pair was reversing inside of the Pennant Consolidation after a False Breakout Bullish.
DAILY CHART- PENNANT, UPTREND
 |
DAILY CHART - FALSE BREAKOUT
 |
| FXCM Charts used for Trading Signals and Setups based on New York Close Daily Candle |
There was an initial uncertainty about the viability of the trade which led to a small loss of 9.5 Pips when the trade was closed earlier on. However, after confirming its adherence to my rules, entry took place on the 4 Hour Chart a few days later. At the end of the established holding period, the trade captured 76 Pips.
DAILY CHART RESULT
 |
| Dukascopy Swiss Forex Marketplace used for Live Account Trades |
- False Breakouts move to the other end of the Consolidation;
- Holding Period;
- Near End Value;
- Entry at Follow-Up 4 Hour Setups;
____________________________________________________
AUD USD - SEPTEMBER 11 - SEPTEMBER 17, 2014
Trade Type
|
Consolidation Breakout
|
Signal Given
|
Daily Chart Bearish Candle
|
Target
|
Breakout Equivalent
|
Result
|
148 Pips
|
This pair was breaking out of large Pennant Consolidation.
DAILY CHART SETUP

Entry then took place at the third candle with the Stop Loss and Take Profit targets set based on the parameters of the Methodology.
DAILY CHART- ENTRY SETUP

After 4 Days, the target was hit for 148 Pips, following a temporary pullback close to the opening price.
DAILY CHART- TARGET HIT

DAILY CHART- LIVE ACCOUNT RESULT

KEY CONCEPTS OF TRADE
- Breakouts from Consolidations are often fast and sharp;
- Temporary Pullbacks can take place before targets are hit;
- Stop Losses placed at the right area protects trade from unexpected spikes;
____________________________________________________
AUD NZD - AUGUST 27- SEPTEMBER 3, 2014
Trade Type
|
Consolidation Breakout
|
Signal Needed
|
Daily Chart
|
Target
|
Breakout Equivalent
|
Result
|
70 Pips
|
The setup for this trade was a simultaneous breakout from a large Pennant and the Range pattern on top of its Resistance boundary.
DAILY CHART CONSOLIDATION

The signal to start the breakout was a strong Bull Candle above the Resistance of the Range.
DAILY CHART SIGNAL

Entry took place immediately with the Stop Loss positioned at the appropriate area according to the trading rules. The target was set to just under the Breakout Equivalent of the Range (see Trading Manual).
BREAKOUT TARGET

After a few days, the trade was exited for 70 Pips instead of the targeted 132 Pips. This was due to a specific criterion established in the Methodology that required this action for this trade.
LIVE ACCOUNT TRADE RESULT

The reversal that took place a few days later confirmed that the market was not expected to go beyond this exit point.
DAILY CHART- PULLBACK

KEY CONCEPTS OF TRADE
- Early Exit of Trades is often Necessary;
- Breakouts from Consolidation can be smaller than Expected;
- Breakouts from Large Consolidations can start with breaks of small Consolidations;
____________________________________________________
AUD USD - JULY 1ST, 2014
Trade Type
|
Breakout, Medium Consolidation
|
Signal Needed
|
Daily Chart
|
Target
|
Breakout Equivalent
|
Result
|
-100 Pips
|
_____________________________________________________________
The
intention here was to continue to go long in favour of the Aussie in
response to the breakout signal provided above the Daily Chart's
Pennant. The pair had actually formed a smaller Pennant above a larger
Pennant before providing the Bull Candle Signal for entry. Instead of
breaking higher, however, the currency pair reversed unexpectedly
despite having a strong setup and signal. So what could have been the
reason for this loss?
Let's first
take a look at what the overall picture was on the Daily Chart. As we
see in the chart below, the smaller Pennant was essentially testing the
broken Resistance before giving the breakout signal.
DAILY CHART
 |
| Source: FXCM Marketscope |
This was also taking place in an uptrend that added support for the currency pair to continue moving higher. Following the close of this candle, entry took place immediately with the Stop Loss set at the appropriate point on the 4 Hour Chart and the target of the Breakout Equivalent put in place. Within a few days, the market reversed sharply to take out the trade, resulting in the loss of 100 Pips.
DAILY CHART
 |
| Source: FXCM Marketscope |
The issue at hand following that loss and trading losses in general, was to ascertain the possible cause especially given the apparent clarity and strength of this setup. Two separate, but related reasons could have provided the answer.
SCENARIO 1
It was quite possible that these two Pennants were actually about to give
way to the formation of a larger Range Setup. This is something that
happens from time to time in the currency market. If this was the case,
then this is what it could have looked like.
DAILY CHART
 |
| Source: FXCM Marketscope |
If this was going to be formed, then we would either have seen another bullish signal to continue the uptrend or a bearish breakout that started a downtrend.
SCENARIO 2
The
alternate scenario involved taking a wider view of this currency pair's
previous patterns. The unexpected reversal that took place appeared may have been the start of a bearish wave within a much larger
Consolidation setup that was going to be formed.
DAILY CHART
 |
| Source: FXCM Marketscope |
Confirmation of this was going to come in subsequent days or weeks in the form any of these Candlestick Formations below the Uptrend Line;
- ABC Reversal Signal;
- Formation & Break of Small Consolidation;
- Counter Trend Line Setup & Break;
Provided
these signals were strong, any of them would lead to a steady downtrend
over the next few months until Support is hit, over 500 Pips away.
As you can see from the 148-Pip trade, this was exactly what took place.
As you can see from the 148-Pip trade, this was exactly what took place.
Summary
Although these are early days in the life of this strategy, the results generated and its ability to beat benchmark returns with only a handful of trades bodes very well for the profitability of those who use it for their trading. The parameters of the Methodology are based on the assumption that certain patterns in the market will always arise each month. Given that these patterns have been present throughout all types of market conditions in the past and in 2014, long-term profitability is simply a matter of taking advantage of them patiently and confidently.
___________________________________________________________
RECENT EMAIL FROM CLIENT

____________________________
GET STARTED TODAY
____________________________
GET STARTED TODAY
____________________________

 |
| US$99.00 |
 |
| US$99.00 |

|
| US$69.99 |

|
| US$49.99 |

 |
FREE
 |
 |
| FREE |
_____________________________
Duane Shepherd
(M.Sc. Economics, B.Sc. Management and Economics)
Currency Analyst/Trader
Contact: shepherdduane@gmail.com
Twitter: @WorldWide876
Facebook: DRFXTRADING


Hey Everybody,
ReplyDeleteI've included a list of the highest ranking forex brokers:
1. Most Recommended Forex Broker
2. eToro - $50 minimum deposit.
Here is a list of top forex tools:
1. ForexTrendy - Recommended Odds Software.
2. EA Builder - Custom Strategies Autotrading.
3. Fast FX Profit - Secret Forex Strategy.
I hope you find these lists beneficial.