200-Pip Targets Still Hit During Financial Crisis, Using Methodology
During the
infamous Financial Crisis of 2007-08 and its aftermath, many trading strategies
began losing money because of the dramatic increase in market volatility.
Methodologies that functioned with very few hiccups before the Crisis, were no
longer profitable and could not adjust to the new scenarios that unfolded over subsequent years. Nevertheless, the methodology outlined in the Trading Manual held firm despite the market turbulence experienced during that time.
The methodology uses Price-Action patterns on the Daily & 4 Hour
Charts to identify high probability trades that provide between 100 and 200 Pips. The setups that provide these opportunities exist during normal periods of market activity as well as heightened periods of volatility coinciding with safe-haven investment flows.
The European
Sovereign Debt Crisis and the 2007-08 Financial Crisis stand out
as strong examples of factors that lead to increased volatility. Since
the formation of consolidation tends to characterize these market conditions, we can look
at examples of how the strategy would have been applied to this type of setup. In each of these examples, explanations of the technical factors that would justify entry and exit are provided.
CONSOLIDATION
BREAKOUTS
Consolidation
and breakouts from consolidation are typical market patterns seen throughout
the currency market. Consolidations are periods of indecision and low market
liquidity in which traders are uncertain as to how a currency pair will be affected by a major, underlying economic factor. The larger the
consolidation, the more significant is the underlying scenario that is unfolding. Whenever this
issue finally comes to light in the form of a single or series of news releases, a sharp breakout at the Support or the Resistance of the consolidation will take place. The direction of this breakout will be in favour of the currency that benefits from the reaction to the news by investors and traders.
The graph below
shows the large Pennant consolidation that was formed for the EURO JPY pair between July
and August 2011. The Pennant coincided with one of the periods of the European Sovereign Debt
Crisis in which Greece was believed to be on the brink of exiting the eurozone due to its severe fiscal and economic challenges. It was also feared that such an exit would have a ripple effect that led to other countries leaving the Union as well.
FIGURE 1- EURO JPY - DAILY CHART

In July, Greece was
eventually provided with the assistance it needed to resolve its crisis and
prevent contagion among other European countries. However, the market went back
into crisis mode in August when European Commission President Jose Manual
Barros warned that the Sovereign Debt Crisis was spreading beyond the periphery
of the eurozone. Yields on government bonds from Spain
and Italy
rose sharply as investors demanded larger returns to lend to these countries. As
a result, the European Central Bank said it would buy the government bonds of these countries to reduce their borrowing costs, amid concerns that
they would be also be hit by a crisis.
Adding
fuel to the fire of market uncertainty were developments taking place in the
United States- the epicenter of the 2007-08 Financial Crisis. In August, Standard
& Poor’s made a landmark decision to downgrade US
Within this
context, a breakout short from the Pennant to reflect the selling of Euro and
the safe-haven buying of the Japanese Yen was inevitable. This began on September 8, 2011, with a
bearish candle signal on the Daily Chart.
FIGURE 2- EURO JPY- DAILY CHART SIGNAL

As the currency
pair presented this trading opportunity, entry took place immediately, with the
target set for 200 Pips as per the methodology.
FIGURE 3 - EURO JPY - DAILY CHART RESULT

The target was
hit after few days for 220 Pips, with slippage taking place to capture a few extra pips. This exit point also coincided with
the appearance of Tweezer Bottoms, which
are signals that indicate the end of a Breakout.
During this
time, a Range had been formed on the Daily Chart of the USD CAD pair that also
reflected the pessimistic sentiment of the market. This Consolidation would also be broken to
reflect the safe-haven buying of the US Dollar.
FIGURE 4 - DAILY
CHART- USD CAD

The signal to
start the breakout came on September 21, 2011 in the form of a bullish candle
breaking Resistance. That signal coincided with statements from the
International Monetary Fund in which it forecast slower growth in the UK and the US and warned that the Sovereign
debt and banking sector problems in the euro area had proven much more
tenacious than expected.
FIGURE 5 - USD
CAD - DAILY CHART

Once again,
entry took place on the same day of the signal, with the target of 200 Pips
being set. This target was successfully hit a few days later.
FIGURE 6- USD CAD- DAILY CHART RESULT
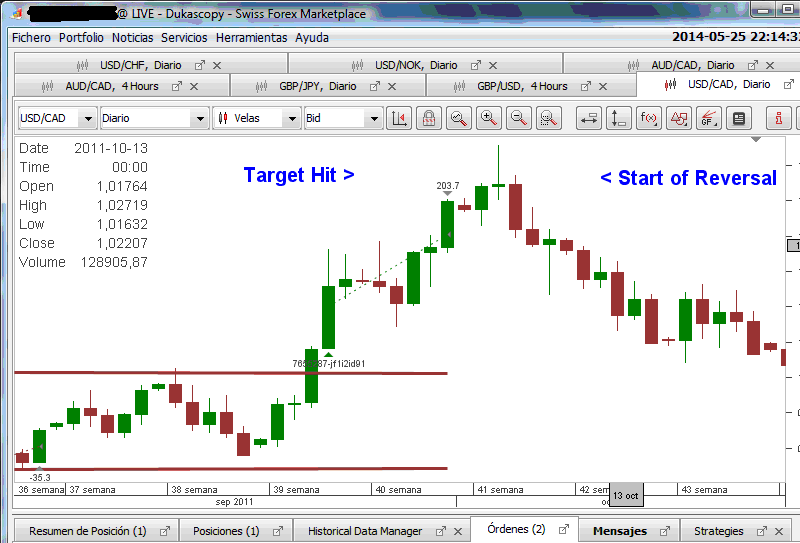
The exit point
for this trade took place at the area where consolidations normally end. This
area is referred to as the Breakout Equivalent and is a concept that is applied
to all consolidation types. Once this is correctly identified - based on
certain parameters related to the consolidation in question- exit points for
trades can be more confidently established. This allows the trader to be able
to avoid the volatility and the pullbacks that normally follow the end of these
breakouts.
The 2008 Financial
Crisis also provided opportunities that were clear, strong and in sync with the
types of setups that are targeted for trading. These setups formed part of the back-testing of the methodology and confirmed its robustness during these tail risk events. Consolidations were also formed
during the early stages of the crisis, but these were much larger given the
severity of the situation that was unraveling.
TRADING WITHIN CONSOLIDATION
Trades can also
be executed within Consolidation boundaries instead of waiting until they are
broken. To justify trading within these volatile setups, however, the distance
between Support and Resistance should at least be 300 Pips. The EURO USD
provided such a Consolidation, when it formed a
600-Pip Range between March and August of 2008.
FIGURE 7 - EURO USD-DAILY
CHART

There were several
important financial events that took place during this period, that sustained
the high level of tension in the market. These included;
- The US Federal Reserve Board announcing the creation of the Term Securities Lending Facility, which would lend up to US$ 200 billion of Treasury securities for 28-day terms;
- The Federal Open Market Committee increasing its swap lines with the ECB;
- The Federal Reserve Board approving the financing arrangement announced by JPMorgan Chase and Bear Stearns while also stating that it would closely monitor market conditions and provide liquidity as necessary to ensure the orderly function of the financial system;
- The Federal Reserve Bank of New York announcing that it would provide term financing to facilitate JPMorgan Chase & Co`s acquisition of The Bear Stearns Companies Inc.;
- The Office of
Thrift Supervision in the
- The US Securities Exchange Commission issues an emergency order temporarily prohibiting naked short selling in the securities of Fannie Mae, Freddie Mac and primary dealers at commercial and investment banks;
Shortly after
these events, a Bear Crown Setup appeared on July 29, 2008 at Resistance to
signal a move down to Support. This would be the final bearish trend inside the
Range, ahead of the breakout short and more aggressive safe-haven buying of the
Greenback.
FIGURE 8 -
DAILY CHART- EURO USD

With the strong
signal given, entry would have taken place at the close of the candle at 1,5589
and the 200-Pip target set at 1,5389. This would have been hit a few days later, just above the Support at 1,5320.
DOWNTREND ENTRY SETUP
The NZD JPY was
already in free fall when it provided an opportunity to continue short in
favour of the Yen. A small consolidation in the form of a Pennant was formed
and then broken in October 2008.

With these and
other trading opportunities, entry can take place on the 4 Hour Chart if the
Daily Chart does not meet certain criteria established. Based on those
criteria, entry on the 4 Hour Chart would have been the better choice.
FIGURE 10- NZD JPY- 4 HOUR ENTRY SETUP

The 200-Pip
target would have been hit after only a few hours, just ahead of the Breakout
Equivalent of the Daily Chart´s Pennant. Again, this is the area where the
breakout from consolidation ends ahead of the expected pullback and reversal.
CONSOLIDATION BREAKOUT
Safe-haven
buying of the Swiss Franc was also taking place during the crisis, with the
EURO CHF being one of the pairs that reflected these flows. The pair had also
formed a large Range before breaking short by 1,500 Pips in just a month. Prior to the start of the breakout, there was
a small Pennant just below the Range that tested the Support before the
breakout actually began.
FIGURE
11 - EURO CHF- DAILY CHART

A bearish signal
to break the Support of this Pennant was given on the 3rd of October. Entry
would have taken place on the 4 Hour Chart since this offered a Stop Loss
within the maximum established.
FIGURE 12- EURO CHF DAILY CHART SIGNAL

FIGURE-13- EURO CHF - 4 HOUR CHART

The examples
presented here are a mere small sample of the opportunities that have arisen
over the last 6 years. Regardless of the
prevailing market conditions, there will always be currency pairs that provide
high probability setups that fit the criteria established in the trading
strategy. The key is to have the right tools to accurately identify these setups and capture as many of the pips on offer, as often as possible.
RECENT EMAIL FROM CLIENT

____________________________________________________
SUBSCRIBE TODAY
____________________________________________________


 |
| US$120.00 |
 |
___________________________________________
Duane Shepherd
(M.Sc. Economics, B.Sc. Management and Economics)
Currency Analyst/Trader
Contact: shepherdduane@gmail.com
Twitter: @WorldWide876
Facebook: DRFXTRADING
_____________________________________________________________


Comments
Post a Comment